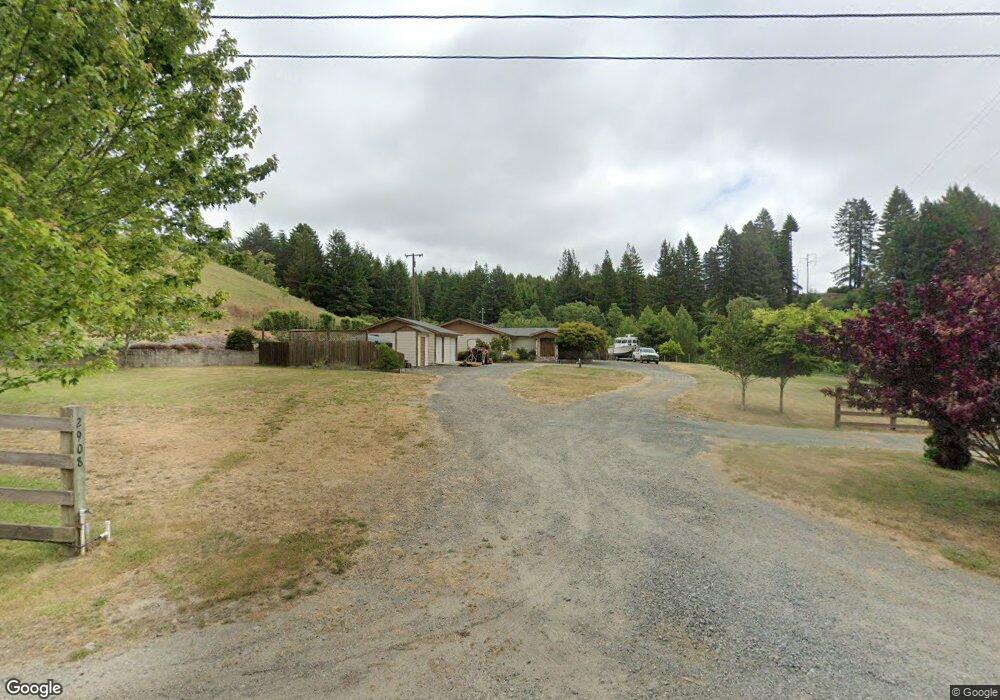
2908 Loop Rd Fortuna, CA 95540
Estimated Value: $449,000 - $532,355
3
Beds
2
Baths
1,644
Sq Ft
$309/Sq Ft
Est. Value
About This Home
This home is located at 2908 Loop Rd, Fortuna, CA 95540 and is currently estimated at $508,089, approximately $309 per square foot. 2908 Loop Rd is a home located in Humboldt County with nearby schools including East High School, Fortuna Union High School, and Redwood Preparatory Charter School.
Ownership History
Date
Name
Owned For
Owner Type
Purchase Details
Closed on
Apr 28, 2011
Sold by
Egan John and Imperiale Egan Rene
Bought by
Zulliger Joshua R
Current Estimated Value
Home Financials for this Owner
Home Financials are based on the most recent Mortgage that was taken out on this home.
Original Mortgage
$248,494
Outstanding Balance
$170,095
Interest Rate
4.71%
Mortgage Type
VA
Estimated Equity
$337,994
Purchase Details
Closed on
Aug 10, 2010
Sold by
Aurora Loan Services Llc
Bought by
Egan John and Imperiale Egan Rene
Purchase Details
Closed on
Jan 14, 2010
Sold by
Bagley Frances
Bought by
Aurora Loan Services Llc
Create a Home Valuation Report for This Property
The Home Valuation Report is an in-depth analysis detailing your home's value as well as a comparison with similar homes in the area
Purchase History
| Date | Buyer | Sale Price | Title Company |
|---|---|---|---|
| Zulliger Joshua R | $273,000 | Humboldt Land Title Company | |
| Egan John | $266,500 | North American Title Co Inc | |
| Aurora Loan Services Llc | $560,001 | Accommodation |
Source: Public Records
Mortgage History
| Date | Status | Borrower | Loan Amount |
|---|---|---|---|
| Open | Zulliger Joshua R | $248,494 |
Source: Public Records
Tax History
| Year | Tax Paid | Tax Assessment Tax Assessment Total Assessment is a certain percentage of the fair market value that is determined by local assessors to be the total taxable value of land and additions on the property. | Land | Improvement |
|---|---|---|---|---|
| 2025 | $4,402 | $415,116 | $153,735 | $261,381 |
| 2024 | $4,402 | $406,977 | $150,721 | $256,256 |
| 2023 | $4,317 | $398,998 | $147,766 | $251,232 |
| 2022 | $4,305 | $391,175 | $144,869 | $246,306 |
| 2021 | $4,242 | $383,506 | $142,029 | $241,477 |
| 2020 | $3,699 | $330,087 | $140,573 | $189,514 |
| 2019 | $3,632 | $323,616 | $137,817 | $185,799 |
| 2018 | $3,490 | $317,271 | $135,115 | $182,156 |
| 2017 | $3,418 | $311,051 | $132,466 | $178,585 |
| 2016 | $3,334 | $304,953 | $129,869 | $175,084 |
| 2015 | $3,094 | $291,016 | $127,919 | $163,097 |
| 2014 | $3,014 | $285,317 | $125,414 | $159,903 |
Source: Public Records
Map
Nearby Homes
- 109 Pampas Ln
- 250 Paradise Dr
- 301 Paradise Dr
- 316 Paradise Dr
- 315 Paradise Dr
- 4372 Forest Hills Dr
- 3888 Rohnerville Rd
- 4111 Rohnerville Rd
- 1727 Bluejay Ct
- 148 Ridge View Ct
- 3580 Larsen Ln
- 3581 Clifton Way
- 3629 Kenmar Rd
- 3414 Church St
- 462 Francesco Place
- 00 View Dr
- 3746 Jones Ct
- 1545 Xavier Ct
- 1777 Xavier Ct
- 19 Pinecrest Dr
Your Personal Tour Guide
Ask me questions while you tour the home.