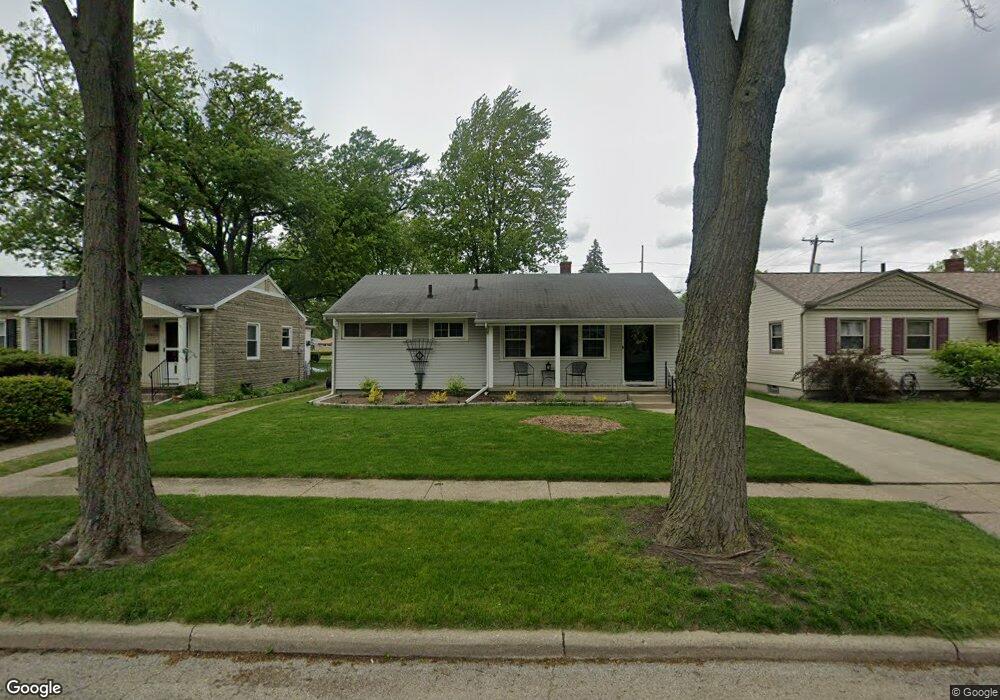
2908 Nash Rd Toledo, OH 43613
DeVeaux NeighborhoodEstimated Value: $136,000 - $163,000
3
Beds
1
Bath
912
Sq Ft
$162/Sq Ft
Est. Value
About This Home
This home is located at 2908 Nash Rd, Toledo, OH 43613 and is currently estimated at $147,888, approximately $162 per square foot. 2908 Nash Rd is a home located in Lucas County with nearby schools including Jefferson Junior High School, Washington Junior High School, and Whitmer High School.
Ownership History
Date
Name
Owned For
Owner Type
Purchase Details
Closed on
Dec 9, 2013
Sold by
Schrickel Lorenda A and Schrickel Lorenda
Bought by
Schrickel Mark A
Current Estimated Value
Purchase Details
Closed on
Aug 23, 1999
Sold by
Bourland Colleen A
Bought by
Schrickel Mark A and Schrickel Lorenda A
Home Financials for this Owner
Home Financials are based on the most recent Mortgage that was taken out on this home.
Original Mortgage
$64,000
Outstanding Balance
$18,202
Interest Rate
8.25%
Estimated Equity
$129,686
Purchase Details
Closed on
Jul 1, 1998
Sold by
Bourland Colleen A and Rembold Paul
Bought by
Schrikel Mark and Schrikel Lorenda
Home Financials for this Owner
Home Financials are based on the most recent Mortgage that was taken out on this home.
Original Mortgage
$64,500
Interest Rate
7.25%
Mortgage Type
Seller Take Back
Purchase Details
Closed on
Jul 30, 1993
Sold by
Bourland James D and Bourland Colleen
Purchase Details
Closed on
Dec 8, 1988
Sold by
Bourland Bourland J J and Bourland C
Create a Home Valuation Report for This Property
The Home Valuation Report is an in-depth analysis detailing your home's value as well as a comparison with similar homes in the area
Home Values in the Area
Average Home Value in this Area
Purchase History
| Date | Buyer | Sale Price | Title Company |
|---|---|---|---|
| Schrickel Mark A | -- | None Available | |
| Schrickel Mark A | $66,500 | -- | |
| Schrikel Mark | $66,500 | -- | |
| -- | -- | -- | |
| -- | -- | -- |
Source: Public Records
Mortgage History
| Date | Status | Borrower | Loan Amount |
|---|---|---|---|
| Open | Schrickel Mark A | $64,000 | |
| Closed | Schrikel Mark | $64,500 |
Source: Public Records
Tax History
| Year | Tax Paid | Tax Assessment Tax Assessment Total Assessment is a certain percentage of the fair market value that is determined by local assessors to be the total taxable value of land and additions on the property. | Land | Improvement |
|---|---|---|---|---|
| 2025 | -- | $33,565 | $7,700 | $25,865 |
| 2024 | $765 | $33,565 | $7,700 | $25,865 |
| 2023 | $1,788 | $33,425 | $6,685 | $26,740 |
| 2022 | $1,815 | $33,425 | $6,685 | $26,740 |
| 2021 | $1,846 | $33,425 | $6,685 | $26,740 |
| 2020 | $1,699 | $28,035 | $5,565 | $22,470 |
| 2019 | $2,313 | $28,035 | $5,565 | $22,470 |
| 2018 | $2,118 | $28,035 | $5,565 | $22,470 |
| 2017 | $2,145 | $26,635 | $4,760 | $21,875 |
| 2016 | $2,143 | $76,100 | $13,600 | $62,500 |
| 2015 | $2,135 | $76,100 | $13,600 | $62,500 |
| 2014 | $1,815 | $26,640 | $4,760 | $21,880 |
| 2013 | $1,815 | $26,640 | $4,760 | $21,880 |
Source: Public Records
Map
Nearby Homes
- 2849 W Laskey Rd
- 2820 Claredale Rd
- 4807 Brott Rd
- 2834 Wyndale Rd
- 4722 Bowser Dr
- 4726 Bowen Rd
- 5111 Elaine Dr
- 2645 Boxwood Rd
- 2846 Elsie Ave
- 2842 Oak Grove Place
- 4932 Bales Rd
- 2313 Oak Grove Place
- 4730 Vogel Dr
- 4924 Roywood Rd
- 2659 Oak Grove Place
- 5103 Fairgreen Dr
- 3016 Lambert Dr
- 5143 Fairgreen Dr
- 5163 Fairgreen Dr
- 5720 Secor Rd
Your Personal Tour Guide
Ask me questions while you tour the home.