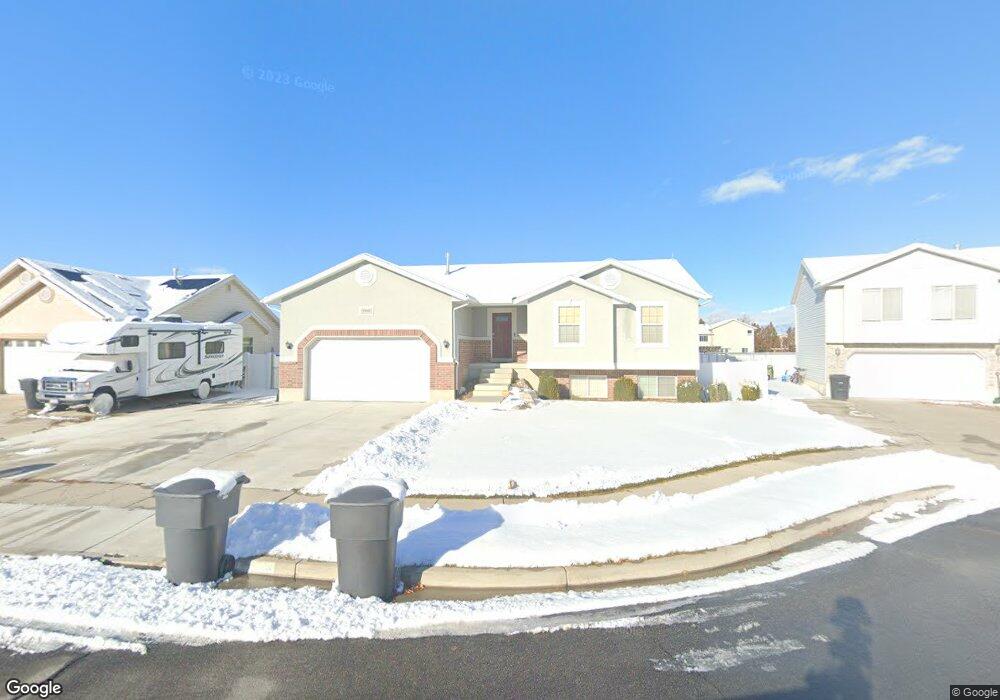
2908 W 2025 N Clearfield, UT 84015
Estimated Value: $489,115 - $535,000
3
Beds
2
Baths
1,467
Sq Ft
$350/Sq Ft
Est. Value
About This Home
This home is located at 2908 W 2025 N, Clearfield, UT 84015 and is currently estimated at $513,029, approximately $349 per square foot. 2908 W 2025 N is a home located in Davis County with nearby schools including West Clinton Elementary School, West Point Junior High School, and Clearfield High School.
Ownership History
Date
Name
Owned For
Owner Type
Purchase Details
Closed on
Dec 9, 2003
Sold by
Powers Michael and Powers Amanda
Bought by
Powers Michael C and Powers Amanda C
Current Estimated Value
Home Financials for this Owner
Home Financials are based on the most recent Mortgage that was taken out on this home.
Original Mortgage
$147,500
Outstanding Balance
$68,001
Interest Rate
5.92%
Mortgage Type
New Conventional
Estimated Equity
$445,028
Purchase Details
Closed on
Nov 20, 2003
Sold by
Us Development Inc
Bought by
Powers Michael and Powers Amanda
Home Financials for this Owner
Home Financials are based on the most recent Mortgage that was taken out on this home.
Original Mortgage
$147,500
Outstanding Balance
$68,001
Interest Rate
5.92%
Mortgage Type
New Conventional
Estimated Equity
$445,028
Create a Home Valuation Report for This Property
The Home Valuation Report is an in-depth analysis detailing your home's value as well as a comparison with similar homes in the area
Home Values in the Area
Average Home Value in this Area
Purchase History
| Date | Buyer | Sale Price | Title Company |
|---|---|---|---|
| Powers Michael C | -- | Btc | |
| Powers Michael | -- | Bonneville Title Company Inc |
Source: Public Records
Mortgage History
| Date | Status | Borrower | Loan Amount |
|---|---|---|---|
| Open | Powers Michael C | $147,500 |
Source: Public Records
Tax History Compared to Growth
Tax History
| Year | Tax Paid | Tax Assessment Tax Assessment Total Assessment is a certain percentage of the fair market value that is determined by local assessors to be the total taxable value of land and additions on the property. | Land | Improvement |
|---|---|---|---|---|
| 2025 | $2,648 | $254,651 | $83,254 | $171,397 |
| 2024 | $2,657 | $256,850 | $92,218 | $164,632 |
| 2023 | $2,499 | $447,000 | $103,688 | $343,312 |
| 2022 | $2,663 | $263,450 | $64,945 | $198,505 |
| 2021 | $2,385 | $350,000 | $78,745 | $271,255 |
| 2020 | $2,059 | $299,000 | $65,591 | $233,409 |
| 2019 | $1,973 | $280,000 | $79,110 | $200,890 |
| 2018 | $1,707 | $238,000 | $67,146 | $170,854 |
| 2016 | $1,572 | $113,135 | $25,865 | $87,270 |
| 2015 | $1,506 | $103,070 | $25,865 | $77,205 |
| 2014 | $1,350 | $93,855 | $25,865 | $67,990 |
| 2013 | -- | $104,678 | $22,908 | $81,770 |
Source: Public Records
Map
Nearby Homes
- 1958 N 2750 W
- 3941 W 1800 N
- 2617 N 2080 W Unit 176
- 2413 N Eurasian Crane Rd
- 339 N 3250 W Unit 12
- Harvard Plan at Summerfield - Enclave
- 2208 W 2615 N
- Linden Plan at Summerfield - Vista
- Yale Plan at Summerfield - Enclave
- Gambel Oak Plan at Summerfield - Vista
- Cedar Plan at Summerfield - Vista
- Elm Plan at Summerfield - Vista
- Princeton Plan at Summerfield - Enclave
- Cambridge Plan at Summerfield - Enclave
- Cornell Plan at Summerfield - Enclave
- Sycamore Plan at Summerfield - Vista
- Berkeley Plan at Summerfield - Enclave
- Birch Plan at Summerfield - Vista
- Stanford Plan at Summerfield - Enclave
- 1648 N 2615 W
- 2908 W 2025 N Unit 15
- 2892 W 2025 N
- 2922 W 2025 N
- 2922 W 2025 N Unit 16
- 2896 W 2025 N
- 2896 W 2025 N Unit 14
- 2936 W 2025 N
- 2936 W 2025 N Unit 17
- 2913 W 2025 N
- 2913 W 2025 N Unit 25
- 2024 N 2895 W
- 2017 N 2895 W
- 2018 N 2895 W
- 2909 W 2100 N
- 2937 W 2025 N
- 2937 W 2025 N Unit 24
- 2954 W 2025 N
- 2954 W 2025 N Unit 18
- 2927 W 2100 N
- 2887 W 2100 N