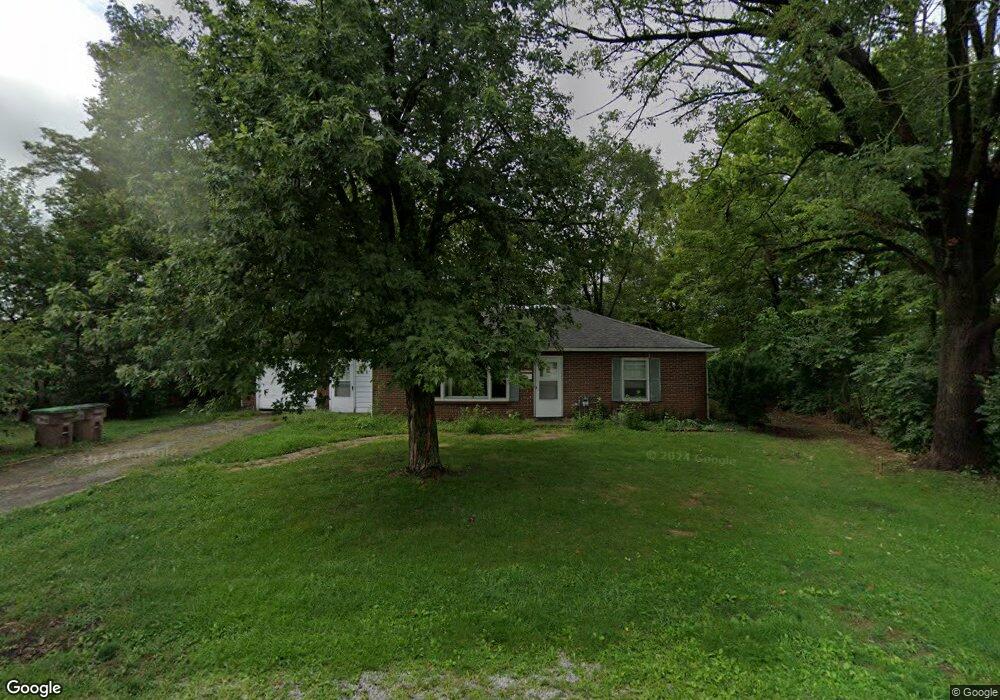
2909 13th St Columbus, IN 47201
Estimated Value: $158,000 - $262,000
2
Beds
1
Bath
2,022
Sq Ft
$101/Sq Ft
Est. Value
About This Home
This home is located at 2909 13th St, Columbus, IN 47201 and is currently estimated at $204,754, approximately $101 per square foot. 2909 13th St is a home located in Bartholomew County with nearby schools including L.F. Smith Elementary School, Central Middle School, and Columbus East High School.
Ownership History
Date
Name
Owned For
Owner Type
Purchase Details
Closed on
Aug 21, 2018
Sold by
Vijay Narsinghani
Bought by
Tulsidas Shobha
Current Estimated Value
Purchase Details
Closed on
Oct 4, 2006
Sold by
Secretary Of Housing And Urban Developme
Bought by
Narsinghani Vijay
Purchase Details
Closed on
Jun 13, 2006
Sold by
Sheriff Of Bartholomew County
Bought by
M&T Mortgage Corporation
Purchase Details
Closed on
Jun 9, 1999
Sold by
Crossmann Communities Partnership
Bought by
Buckner Jeffrey D and Buckner Karen
Create a Home Valuation Report for This Property
The Home Valuation Report is an in-depth analysis detailing your home's value as well as a comparison with similar homes in the area
Home Values in the Area
Average Home Value in this Area
Purchase History
| Date | Buyer | Sale Price | Title Company |
|---|---|---|---|
| Tulsidas Shobha | $66,700 | -- | |
| Narsinghani Vijay | -- | Village Title | |
| M&T Mortgage Corporation | $74,619 | Attorney | |
| Buckner Jeffrey D | $69,900 | -- |
Source: Public Records
Mortgage History
| Date | Status | Borrower | Loan Amount |
|---|---|---|---|
| Closed | M&T Mortgage Corporation | $0 |
Source: Public Records
Tax History
| Year | Tax Paid | Tax Assessment Tax Assessment Total Assessment is a certain percentage of the fair market value that is determined by local assessors to be the total taxable value of land and additions on the property. | Land | Improvement |
|---|---|---|---|---|
| 2025 | $2,923 | $130,000 | $25,300 | $104,700 |
| 2024 | $4,612 | $130,000 | $26,000 | $104,000 |
| 2023 | $4,612 | $203,100 | $45,100 | $158,000 |
| 2022 | $4,123 | $182,100 | $45,100 | $137,000 |
| 2021 | $3,814 | $166,900 | $26,700 | $140,200 |
| 2020 | $2,744 | $120,300 | $26,700 | $93,600 |
| 2019 | $2,338 | $109,600 | $26,700 | $82,900 |
| 2018 | $2,663 | $105,000 | $26,700 | $78,300 |
| 2017 | $2,266 | $104,000 | $25,700 | $78,300 |
| 2016 | $2,273 | $104,000 | $25,700 | $78,300 |
| 2014 | $2,276 | $102,400 | $25,700 | $76,700 |
Source: Public Records
Map
Nearby Homes
- 2911 14th St
- 3022 14th St
- 2620 13th St
- 2641 18th St
- 1825 Lee St
- 1609 Meridian St
- 2896 Two Worlds Dr
- 2816 Two Worlds Dr
- 3605 Saddle Dr
- 2822 22nd St
- 2100 12th St
- 2115 Irwin Dr
- 1739 Caldwell Place
- 3309 Larkspur Ln
- 1302 Court St
- 1837 Caldwell Place
- 2035 10th St
- 507 N Cherry St
- 1918 14th St
- 242 Woodlane Dr
Your Personal Tour Guide
Ask me questions while you tour the home.