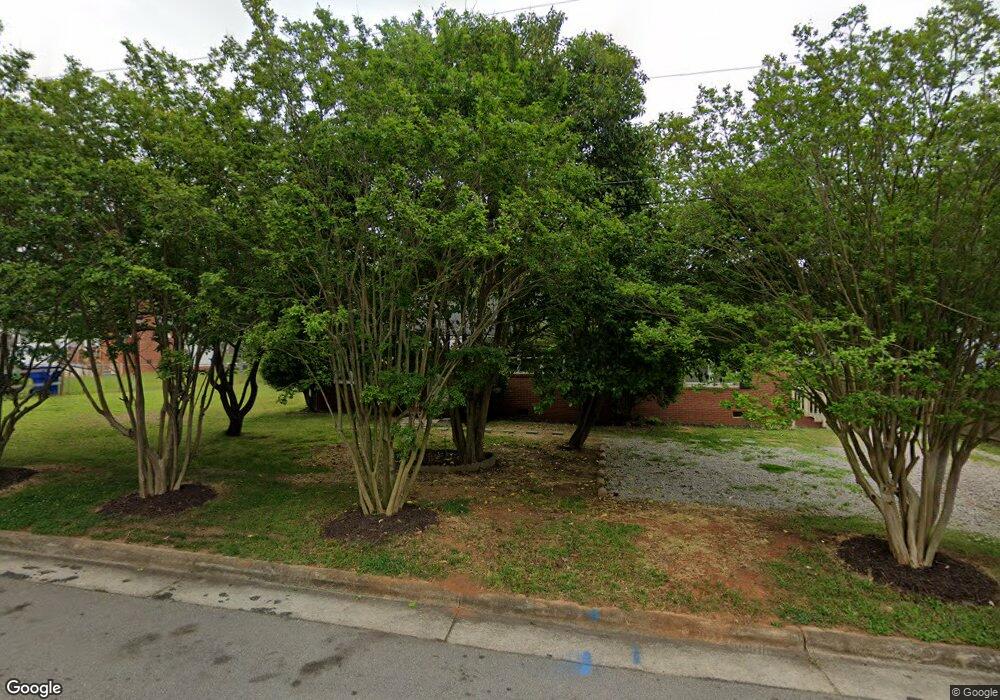
2909 Boone Trail Raleigh, NC 27610
South Raleigh NeighborhoodEstimated Value: $272,000 - $351,000
3
Beds
3
Baths
1,486
Sq Ft
$203/Sq Ft
Est. Value
About This Home
This home is located at 2909 Boone Trail, Raleigh, NC 27610 and is currently estimated at $301,177, approximately $202 per square foot. 2909 Boone Trail is a home located in Wake County with nearby schools including Smith Elementary, North Garner Middle, and Middle Creek High.
Ownership History
Date
Name
Owned For
Owner Type
Purchase Details
Closed on
Mar 13, 2014
Sold by
Us Bank National Assn
Bought by
Aca Group Corp
Current Estimated Value
Purchase Details
Closed on
Feb 25, 2014
Sold by
Seawright Rachel L
Bought by
Us Bank Na
Purchase Details
Closed on
Dec 15, 2005
Sold by
Jp Morgan Chase Bank
Bought by
Seawright Rachel L
Home Financials for this Owner
Home Financials are based on the most recent Mortgage that was taken out on this home.
Original Mortgage
$25,001
Interest Rate
5.85%
Mortgage Type
Stand Alone Second
Purchase Details
Closed on
Sep 30, 2005
Sold by
Mcclain Julia
Bought by
Jp Morgan Chase Bank
Purchase Details
Closed on
Jul 15, 2005
Sold by
Mcclain Julia and Mcclain Julia A
Bought by
Simms Phillis
Create a Home Valuation Report for This Property
The Home Valuation Report is an in-depth analysis detailing your home's value as well as a comparison with similar homes in the area
Home Values in the Area
Average Home Value in this Area
Purchase History
| Date | Buyer | Sale Price | Title Company |
|---|---|---|---|
| Aca Group Corp | $67,500 | None Available | |
| Us Bank Na | $76,000 | None Available | |
| Seawright Rachel L | $75,500 | None Available | |
| Jp Morgan Chase Bank | $72,250 | None Available | |
| Simms Phillis | -- | -- |
Source: Public Records
Mortgage History
| Date | Status | Borrower | Loan Amount |
|---|---|---|---|
| Previous Owner | Seawright Rachel L | $25,001 | |
| Previous Owner | Seawright Rachel L | $50,000 |
Source: Public Records
Tax History Compared to Growth
Tax History
| Year | Tax Paid | Tax Assessment Tax Assessment Total Assessment is a certain percentage of the fair market value that is determined by local assessors to be the total taxable value of land and additions on the property. | Land | Improvement |
|---|---|---|---|---|
| 2025 | $2,217 | $251,951 | $130,000 | $121,951 |
| 2024 | $2,208 | $251,951 | $130,000 | $121,951 |
| 2023 | $1,368 | $123,694 | $45,000 | $78,694 |
| 2022 | $1,272 | $123,694 | $45,000 | $78,694 |
| 2021 | $1,224 | $123,694 | $45,000 | $78,694 |
| 2020 | $1,202 | $123,694 | $45,000 | $78,694 |
| 2019 | $1,007 | $85,171 | $24,000 | $61,171 |
| 2018 | $951 | $85,171 | $24,000 | $61,171 |
| 2017 | $906 | $85,171 | $24,000 | $61,171 |
| 2016 | $888 | $85,171 | $24,000 | $61,171 |
| 2015 | $1,184 | $112,410 | $34,000 | $78,410 |
| 2014 | $800 | $112,410 | $34,000 | $78,410 |
Source: Public Records
Map
Nearby Homes
- 449 Hacksaw Trail
- 313 Hacksaw Trail
- 567 Hacksaw Trail
- 3028 Spline Cir
- 3113 Bomore Rd Unit Lot 36
- 3203 Bomore Rd Unit Lot 40
- 3209 Bomore Rd Unit Lot 43
- 3211 Bomore Rd Unit Lot 44
- 3304 Bomore Rd Unit Lot 19
- 3306 Bomore Rd Unit Lot 20
- 3215 Bomore Rd Unit Lot 45
- 3314 Bomore Rd Unit Lot 24
- 3321 Bomore Rd Unit Lot 59
- 3217 Bomore Rd Unit Lot 46
- 3219 Bomore Rd Unit Lot 47
- 3313 Bomore Rd Unit Lot 55
- 917 Cross Link Rd
- 3060 Camden Creek Dr
- 3323 Bomore Rd Unit Lot 60
- 913 Skinner Dr
- 504 Rush St
- 2808 Marion Rd
- 2908 Boone Trail
- 2904 Boone Trail
- 2913 Boone Trail
- 512 Rush St
- 2806 Marion Rd
- 2912 Boone Trail
- 516 Rush St
- 505 Shelden Dr
- 508 Hilltop Dr
- 512 Hilltop Dr
- 301 Shelden Dr
- 509 Shelden Dr
- 509 Shelden Dr Unit 1
- 509 Shelden Dr Unit 102
- 509 Shelden Dr Unit 101
- 518 Hilltop Dr
- 513 Shelden Dr
- 2920 Boone Trail