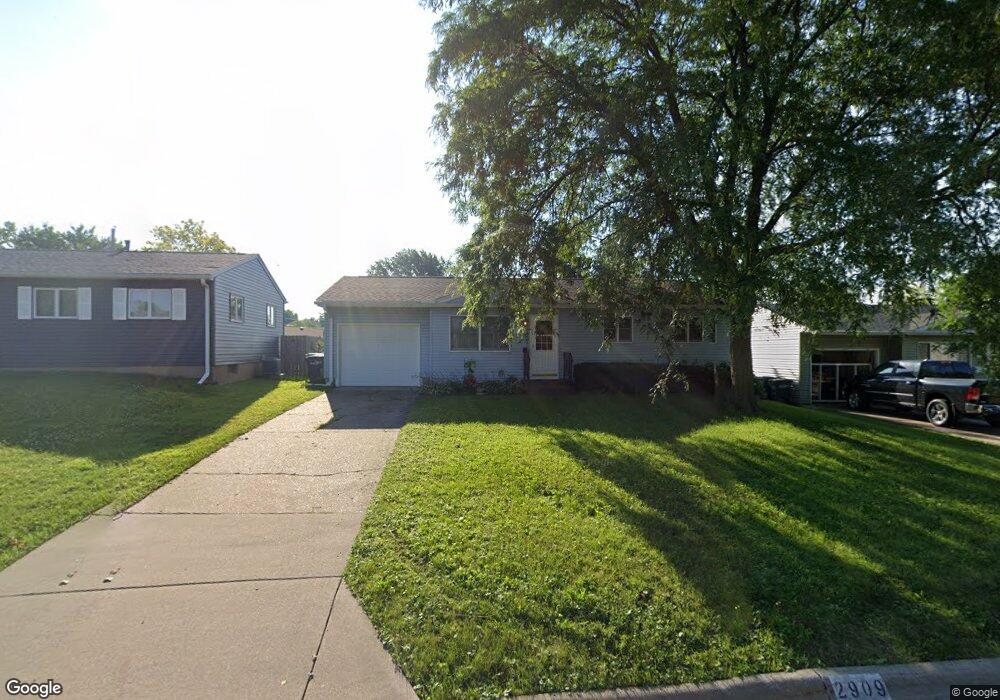
2909 Cypress Dr Bettendorf, IA 52722
Estimated Value: $209,000 - $231,174
2
Beds
3
Baths
1,146
Sq Ft
$196/Sq Ft
Est. Value
About This Home
This home is located at 2909 Cypress Dr, Bettendorf, IA 52722 and is currently estimated at $224,044, approximately $195 per square foot. 2909 Cypress Dr is a home located in Scott County with nearby schools including Grant Wood Elementary School, Bettendorf Middle School, and Bettendorf High School.
Ownership History
Date
Name
Owned For
Owner Type
Purchase Details
Closed on
Apr 18, 2024
Sold by
Cocayne Jerrie and Cheffer Jerrie L
Bought by
Craig W Cheffer Inter Vivos Trust
Current Estimated Value
Purchase Details
Closed on
Apr 16, 2024
Sold by
Cheffer Craig W
Bought by
Craig W Cheffer Inter Vivos Trust
Purchase Details
Closed on
Nov 6, 2013
Sold by
Cocayne Jerrie L and Chaffer Craig W
Bought by
Cheffer Jerrie L and Cheffer Craig W
Home Financials for this Owner
Home Financials are based on the most recent Mortgage that was taken out on this home.
Original Mortgage
$129,222
Interest Rate
4.24%
Mortgage Type
FHA
Purchase Details
Closed on
Aug 12, 2005
Sold by
Schumacher Anthony C and Schumacher Lois A
Bought by
Cocayne Jerrie L
Home Financials for this Owner
Home Financials are based on the most recent Mortgage that was taken out on this home.
Original Mortgage
$96,800
Interest Rate
5.82%
Mortgage Type
New Conventional
Create a Home Valuation Report for This Property
The Home Valuation Report is an in-depth analysis detailing your home's value as well as a comparison with similar homes in the area
Home Values in the Area
Average Home Value in this Area
Purchase History
| Date | Buyer | Sale Price | Title Company |
|---|---|---|---|
| Craig W Cheffer Inter Vivos Trust | -- | None Listed On Document | |
| Craig W Cheffer Inter Vivos Trust | -- | None Listed On Document | |
| Cheffer Jerrie L | -- | None Available | |
| Cocayne Jerrie L | $121,000 | None Available |
Source: Public Records
Mortgage History
| Date | Status | Borrower | Loan Amount |
|---|---|---|---|
| Previous Owner | Cheffer Jerrie L | $129,222 | |
| Previous Owner | Cocayne Jerrie L | $96,800 |
Source: Public Records
Tax History Compared to Growth
Tax History
| Year | Tax Paid | Tax Assessment Tax Assessment Total Assessment is a certain percentage of the fair market value that is determined by local assessors to be the total taxable value of land and additions on the property. | Land | Improvement |
|---|---|---|---|---|
| 2025 | $2,988 | $223,200 | $36,000 | $187,200 |
| 2024 | $2,960 | $203,400 | $24,900 | $178,500 |
| 2023 | $2,940 | $203,400 | $24,900 | $178,500 |
| 2022 | $2,910 | $175,910 | $24,930 | $150,980 |
| 2021 | $2,910 | $175,910 | $24,930 | $150,980 |
| 2020 | $2,746 | $160,070 | $24,930 | $135,140 |
| 2019 | $2,758 | $156,140 | $24,930 | $131,210 |
| 2018 | $2,754 | $156,140 | $24,930 | $131,210 |
| 2017 | $868 | $156,140 | $24,930 | $131,210 |
| 2016 | $2,512 | $143,420 | $0 | $0 |
| 2015 | $2,512 | $137,500 | $0 | $0 |
| 2014 | $2,432 | $137,500 | $0 | $0 |
| 2013 | $2,376 | $0 | $0 | $0 |
| 2012 | -- | $138,910 | $24,930 | $113,980 |
Source: Public Records
Map
Nearby Homes
- 2821 Hillside Ct
- 1113 Summit Hills Dr
- 2846 Magnolia Dr
- 1115 Spruce Hills Dr
- 2625 Holly Dr
- 2612 Crestview Dr
- 2704 Magnolia Dr
- 2507 Holly Dr
- 1101 Hawthorne Dr
- 1509 Golden Valley Dr
- 1523 Golden Valley Dr
- 3205 Candlewick Dr
- 2620 Harmony Dr
- 3010 Greenbrier Dr
- 3322 Clover Hills Dr
- 3604 Welshire Dr
- 1 Oak Park Dr
- 2822 S Hampton Dr
- 6817 Matthews Ct
- 1212 Meadow Lane Dr
- 2903 Cypress Dr
- 2915 Cypress Dr
- 2910 Summit Hills Ct
- 2833 Cypress Dr
- 2923 Cypress Dr
- 2820 Hillside Ct
- 2826 Hillside Ct
- 2904 Cypress Dr
- 2904 Summit Hills Ct
- 2918 Summit Hills Ct
- 2912 Cypress Dr
- 2827 Cypress Dr
- 2931 Cypress Dr
- 2920 Cypress Dr
- 2830 Cypress Dr
- 2814 Hillside Ct
- 2928 Summit Hills Ct
- 2930 Cypress Dr
- 2821 Cypress Dr
- 2937 Cypress Dr