2909 Florence St Berkeley, CA 94705
Elmwood NeighborhoodEstimated Value: $1,600,000 - $2,442,000
4
Beds
--
Bath
2,912
Sq Ft
$661/Sq Ft
Est. Value
About This Home
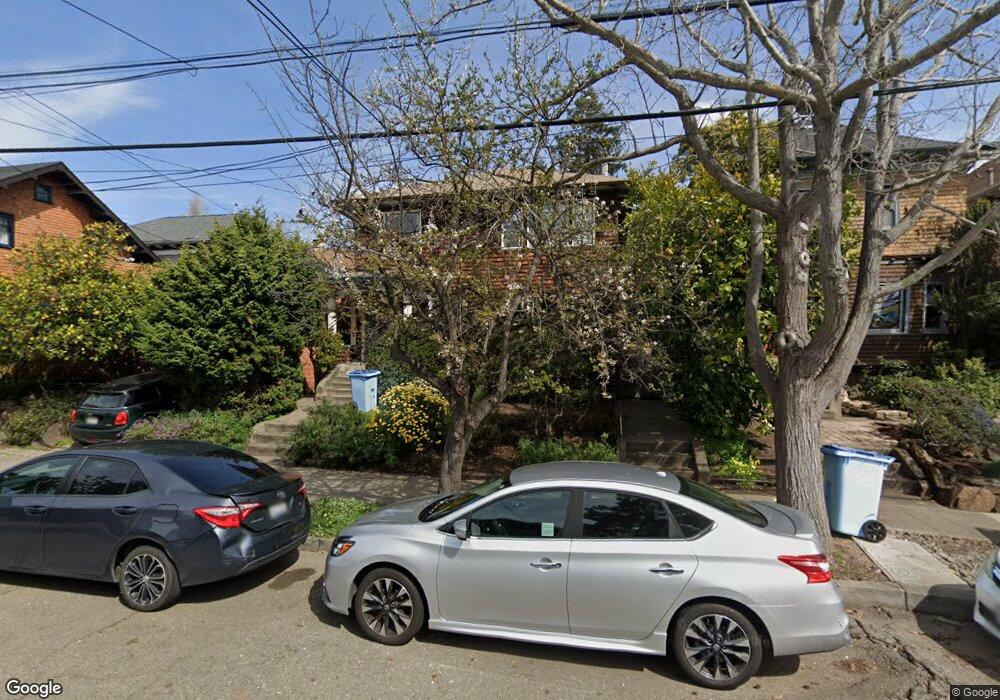
This home is located at 2909 Florence St, Berkeley, CA 94705 and is currently estimated at $1,925,196, approximately $661 per square foot. 2909 Florence St is a home located in Alameda County with nearby schools including Emerson Elementary School, John Muir Elementary School, and Malcolm X Elementary School.
Ownership History
Date
Name
Owned For
Owner Type
Purchase Details
Closed on
May 23, 2022
Sold by
Rice Paul D
Bought by
Paul D Rice Living Trust
Current Estimated Value
Purchase Details
Closed on
Jul 7, 2021
Sold by
Rice Paul D and Aguilar Marisol
Bought by
Rice Paul D and Aguilar Marisol
Home Financials for this Owner
Home Financials are based on the most recent Mortgage that was taken out on this home.
Original Mortgage
$800,000
Interest Rate
2.95%
Mortgage Type
New Conventional
Purchase Details
Closed on
May 27, 1998
Sold by
Sherman Betty 1993 Trust and Donald
Bought by
Rice Paul D and Aguilar Marisol
Home Financials for this Owner
Home Financials are based on the most recent Mortgage that was taken out on this home.
Original Mortgage
$332,000
Interest Rate
7.13%
Purchase Details
Closed on
Dec 16, 1993
Sold by
Sherman Betty
Bought by
Sherman Betty
Create a Home Valuation Report for This Property
The Home Valuation Report is an in-depth analysis detailing your home's value as well as a comparison with similar homes in the area
Home Values in the Area
Average Home Value in this Area
Purchase History
| Date | Buyer | Sale Price | Title Company |
|---|---|---|---|
| Paul D Rice Living Trust | -- | None Listed On Document | |
| Rice Paul D | -- | Chicago Title | |
| Rice Paul D | $415,000 | First American Title Guarant | |
| Sherman Betty | -- | -- |
Source: Public Records
Mortgage History
| Date | Status | Borrower | Loan Amount |
|---|---|---|---|
| Previous Owner | Rice Paul D | $800,000 | |
| Previous Owner | Rice Paul D | $332,000 |
Source: Public Records
Tax History
| Year | Tax Paid | Tax Assessment Tax Assessment Total Assessment is a certain percentage of the fair market value that is determined by local assessors to be the total taxable value of land and additions on the property. | Land | Improvement |
|---|---|---|---|---|
| 2025 | $13,174 | $662,617 | $198,785 | $463,832 |
| 2024 | $13,174 | $649,627 | $194,888 | $454,739 |
| 2023 | $12,871 | $636,891 | $191,067 | $445,824 |
| 2022 | $12,567 | $624,404 | $187,321 | $437,083 |
| 2021 | $12,552 | $612,161 | $183,648 | $428,513 |
| 2020 | $11,676 | $605,887 | $181,766 | $424,121 |
| 2019 | $11,001 | $594,010 | $178,203 | $415,807 |
| 2018 | $10,775 | $582,364 | $174,709 | $407,655 |
| 2017 | $10,390 | $570,948 | $171,284 | $399,664 |
| 2016 | $9,919 | $559,755 | $167,926 | $391,829 |
| 2015 | $9,767 | $551,347 | $165,404 | $385,943 |
| 2014 | $9,735 | $540,548 | $162,164 | $378,384 |
Source: Public Records
Map
Nearby Homes
- 2935 Florence St
- 2917 Telegraph Ave
- 2243 Ashby Ave
- 2477 Prince St
- 2702 Dana St
- 2319 Ward St
- 2643 Stuart St
- 3046 Deakin St
- 6446 Colby St
- 2923 Wheeler St
- 2962 Piedmont Ave
- 2535 Chilton Way
- 2110 Ashby Ave
- 2550 Dana St Unit 2F
- 360 Alcatraz Ave
- 2817 Palm Ct
- 2124 Prince St
- 2601 College Ave Unit 203
- 2601 College Ave Unit 208
- 629 66th St
- 2911 Florence St
- 2424 Russell St
- 2915 Florence St
- 2422 Russell St
- 2428 Russell St
- 2432 Russell St
- 2917 Florence St
- 2921 Florence St Unit 2
- 2919 Florence St Unit 1
- 2436 Russell St
- 2906 Florence St
- 2908 Florence St Unit 2908
- 2904 Florence St
- 2412 Russell St
- 2438 Russell St
- 2918 Florence St
- 2444 Russell St
- 2410 Russell St Unit B
- 2410 Russell St
- 2423 Russell St Unit 11
Your Personal Tour Guide
Ask me questions while you tour the home.