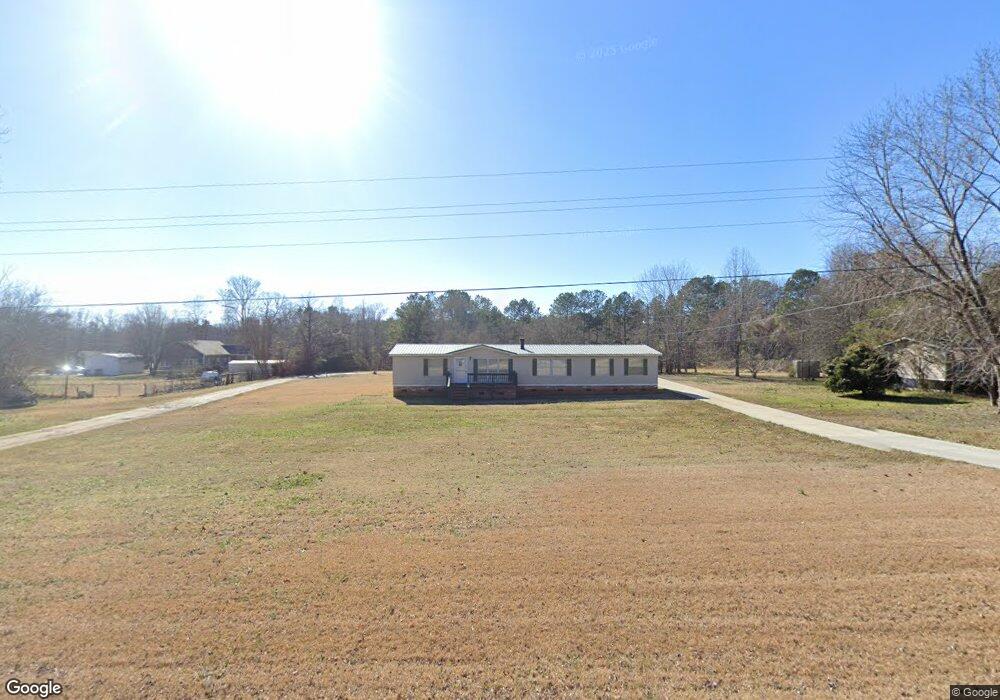
2909 Kingsburry Rd Clover, SC 29710
Estimated Value: $190,991 - $431,000
Studio
--
Bath
2,016
Sq Ft
$166/Sq Ft
Est. Value
About This Home
This home is located at 2909 Kingsburry Rd, Clover, SC 29710 and is currently estimated at $333,998, approximately $165 per square foot. 2909 Kingsburry Rd is a home located in York County with nearby schools including Griggs Road Elementary School, Clover Middle School, and Clover High School.
Ownership History
Date
Name
Owned For
Owner Type
Purchase Details
Closed on
Nov 24, 2010
Sold by
Youngblood Samuel V
Bought by
Simpson Gregory D
Current Estimated Value
Home Financials for this Owner
Home Financials are based on the most recent Mortgage that was taken out on this home.
Original Mortgage
$59,202
Outstanding Balance
$446
Interest Rate
4.31%
Mortgage Type
FHA
Estimated Equity
$333,552
Purchase Details
Closed on
Apr 30, 2010
Sold by
Burris Sarene Y and Youngblood Bethune Sonya
Bought by
Youngblood Samuel V
Purchase Details
Closed on
Jul 9, 2008
Sold by
Youngblood Samuel V and Youngblood Edith R
Bought by
Burris Sarene Y and Youngblood Bethune Sonya
Purchase Details
Closed on
Jul 11, 2002
Sold by
Bankers Trust Company Of California Na
Bought by
Youngblood Samuel V
Purchase Details
Closed on
Apr 16, 2002
Sold by
Simpson Gregory D
Bought by
Bankers Trust Company Of California Na
Create a Home Valuation Report for This Property
The Home Valuation Report is an in-depth analysis detailing your home's value as well as a comparison with similar homes in the area
Home Values in the Area
Average Home Value in this Area
Purchase History
| Date | Buyer | Sale Price | Title Company |
|---|---|---|---|
| Simpson Gregory D | $60,000 | -- | |
| Youngblood Samuel V | -- | -- | |
| Burris Sarene Y | -- | -- | |
| Youngblood Samuel V | $68,000 | -- | |
| Bankers Trust Company Of California Na | $10,000 | -- |
Source: Public Records
Mortgage History
| Date | Status | Borrower | Loan Amount |
|---|---|---|---|
| Open | Simpson Gregory D | $59,202 |
Source: Public Records
Tax History
| Year | Tax Paid | Tax Assessment Tax Assessment Total Assessment is a certain percentage of the fair market value that is determined by local assessors to be the total taxable value of land and additions on the property. | Land | Improvement |
|---|---|---|---|---|
| 2025 | $453 | $3,312 | $1,800 | $1,512 |
| 2024 | $411 | $2,912 | $1,400 | $1,512 |
| 2023 | $422 | $2,912 | $1,400 | $1,512 |
| 2022 | $348 | $2,912 | $1,400 | $1,512 |
| 2021 | -- | $2,912 | $1,400 | $1,512 |
| 2020 | $330 | $2,912 | $0 | $0 |
| 2019 | $341 | $2,760 | $0 | $0 |
| 2018 | $343 | $2,760 | $0 | $0 |
| 2017 | $319 | $2,760 | $0 | $0 |
| 2016 | $301 | $2,760 | $0 | $0 |
| 2014 | $335 | $2,760 | $1,080 | $1,680 |
| 2013 | $335 | $2,940 | $1,080 | $1,860 |
Source: Public Records
Map
Nearby Homes
- 6328 Four Knights Ln
- 3107 Balkan Dr
- 2766 Baird Rd
- 556 Peaceful Creek Dr
- 291 Rippling Creek Dr
- 7035 Twin Streams Ln
- 6040 Little Mountain Rd
- 2345 Kingsburry Rd
- 6396 Crosswinds Dr
- 3429 Thoroughbred Ln
- 000 Old Charlotte Hwy Unit 43
- 2247 Kingsburry Rd
- 500 Pearl Place Ln
- 1541 Hedge Apple Rd
- 00 Charlotte Hwy
- 310 Little Daisy Ln
- 6125 Holland Dr Unit 6
- 1129 Black Walnut Rd
- 1644 Hunters Place Rd
- 1141 Black Walnut Rd
- 2919 S Kingsbury Rd
- 2873 Kingsburry Rd
- 2929 Kingsburry Rd
- 2897 Kingsburry Rd
- 2910 Kingsburry Rd
- 2939 Kingsburry Rd
- 6220 Four Knights Ln
- 2850 Kingsburry Rd
- 2859 Kingsburry Rd
- 6229 Royal Pines Dr
- 2942 Kingsburry Rd
- 6267 Four Knights Ln
- 6310 Four Knights Ln Unit 10
- 2953 Kingsburry Rd
- 6245 Royal Pines Dr
- 2955 Cobby Creek Ct
- 2955 Cobby Creek Ct
- 2960 Kingsburry Rd
- 2959 Cobby Creek Ct
- 6297 Four Knights Ln
Your Personal Tour Guide
Ask me questions while you tour the home.