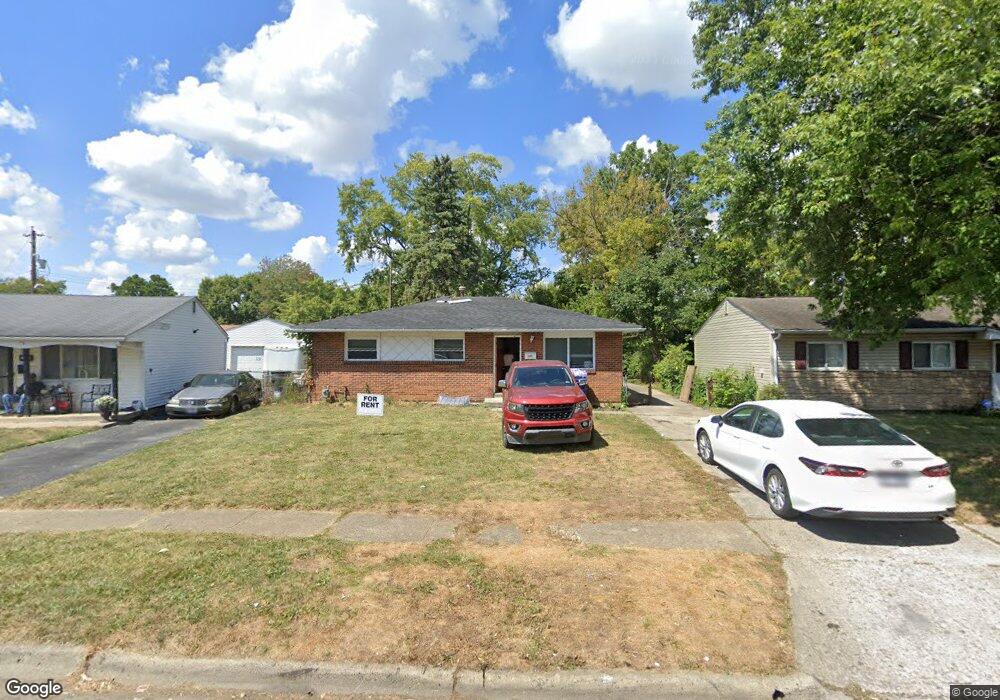
2909 Nuway Rd Columbus, OH 43207
Marion Franklin NeighborhoodEstimated Value: $162,000 - $203,000
3
Beds
1
Bath
999
Sq Ft
$181/Sq Ft
Est. Value
About This Home
This home is located at 2909 Nuway Rd, Columbus, OH 43207 and is currently estimated at $180,846, approximately $181 per square foot. 2909 Nuway Rd is a home located in Franklin County with nearby schools including Watkins Elementary School, Buckeye Middle School, and Marion-Franklin High School.
Ownership History
Date
Name
Owned For
Owner Type
Purchase Details
Closed on
Oct 10, 2012
Sold by
Flanagan Michael
Bought by
Denery Investments Llc
Current Estimated Value
Purchase Details
Closed on
Dec 1, 2011
Sold by
Jackson David E
Bought by
U S Bank National Association Nd
Purchase Details
Closed on
Mar 31, 2006
Sold by
Redman Kevin D and Redman Janice J
Bought by
Jackson David E
Home Financials for this Owner
Home Financials are based on the most recent Mortgage that was taken out on this home.
Original Mortgage
$71,900
Interest Rate
6.33%
Mortgage Type
New Conventional
Purchase Details
Closed on
Aug 13, 2004
Sold by
The Cit Group Consumer Finance Inc
Bought by
Redman Kevin D and Redman Janice J
Purchase Details
Closed on
Mar 31, 2004
Sold by
Lear Harold and Case #03Cve03 3557
Bought by
Cit Group Consumer Finance Inc
Purchase Details
Closed on
May 26, 1994
Bought by
Lear Harold and Lear Grace
Purchase Details
Closed on
Apr 2, 1992
Create a Home Valuation Report for This Property
The Home Valuation Report is an in-depth analysis detailing your home's value as well as a comparison with similar homes in the area
Home Values in the Area
Average Home Value in this Area
Purchase History
| Date | Buyer | Sale Price | Title Company |
|---|---|---|---|
| Denery Investments Llc | -- | None Available | |
| U S Bank National Association Nd | $63,920 | Attorney | |
| Jackson David E | $71,900 | Chicago Tit | |
| Redman Kevin D | $47,900 | Chicago Tit | |
| Cit Group Consumer Finance Inc | $42,000 | -- | |
| Lear Harold | -- | -- | |
| -- | -- | -- |
Source: Public Records
Mortgage History
| Date | Status | Borrower | Loan Amount |
|---|---|---|---|
| Previous Owner | Jackson David E | $71,900 |
Source: Public Records
Tax History Compared to Growth
Tax History
| Year | Tax Paid | Tax Assessment Tax Assessment Total Assessment is a certain percentage of the fair market value that is determined by local assessors to be the total taxable value of land and additions on the property. | Land | Improvement |
|---|---|---|---|---|
| 2024 | $2,811 | $61,330 | $14,110 | $47,220 |
| 2023 | $2,776 | $61,330 | $14,110 | $47,220 |
| 2022 | $1,511 | $28,430 | $8,790 | $19,640 |
| 2021 | $1,514 | $28,430 | $8,790 | $19,640 |
| 2020 | $1,516 | $28,430 | $8,790 | $19,640 |
| 2019 | $1,502 | $24,150 | $7,630 | $16,520 |
| 2018 | $1,156 | $24,150 | $7,630 | $16,520 |
| 2017 | $1,501 | $24,150 | $7,630 | $16,520 |
| 2016 | $892 | $13,130 | $3,820 | $9,310 |
| 2015 | $812 | $13,130 | $3,820 | $9,310 |
| 2014 | $1,409 | $13,130 | $3,820 | $9,310 |
| 2013 | $817 | $26,705 | $4,480 | $22,225 |
Source: Public Records
Map
Nearby Homes
- 3018 Nuway Rd
- 3060 Durham Dr
- 1382 Southfield Dr S
- 3072 Bluefield Dr
- 2685 Bulen Ave
- 2626 Diane Place
- 1204 Koebel Rd
- 3172 Weirton Dr
- 2512 Kitchner Dr
- 2496 Navarre Rd
- 1299 Yolanda Dr
- 3369 Norwalk Rd
- 1138 Hilock Rd Unit 35
- 868 Koebel Ave
- 884 Bruckner Rd
- 868 Lawndale Ave
- 3551 Groveport Rd
- 1124 Rumsey Rd
- 3302 Hilock Place
- 780 Basswood Rd