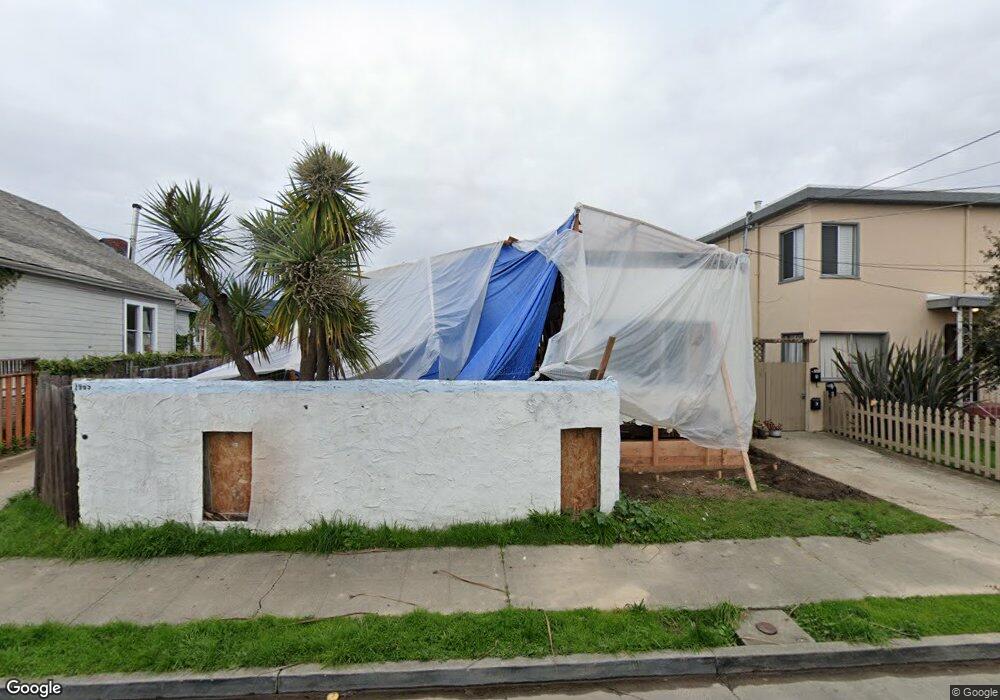
2909 Stanton St Berkeley, CA 94702
West Berkeley NeighborhoodEstimated Value: $1,568,000 - $1,793,000
3
Beds
2
Baths
1,922
Sq Ft
$867/Sq Ft
Est. Value
About This Home
This home is located at 2909 Stanton St, Berkeley, CA 94702 and is currently estimated at $1,667,147, approximately $867 per square foot. 2909 Stanton St is a home located in Alameda County with nearby schools including Malcolm X Elementary School, Washington Elementary School, and Oxford Elementary School.
Ownership History
Date
Name
Owned For
Owner Type
Purchase Details
Closed on
Sep 17, 2021
Sold by
Harrington David and Harrington Kyra
Bought by
Harrington David and Harrington Kyra
Current Estimated Value
Home Financials for this Owner
Home Financials are based on the most recent Mortgage that was taken out on this home.
Original Mortgage
$1,046,500
Outstanding Balance
$952,237
Interest Rate
2.8%
Mortgage Type
New Conventional
Estimated Equity
$714,910
Purchase Details
Closed on
Nov 11, 2019
Sold by
Mio Management
Bought by
Harrington David and Harrington Kyra
Home Financials for this Owner
Home Financials are based on the most recent Mortgage that was taken out on this home.
Original Mortgage
$1,087,500
Interest Rate
3.65%
Purchase Details
Closed on
Oct 17, 2018
Sold by
Bates Chris and Tommie T Bates 1992 Revocable
Bought by
Mio Management
Home Financials for this Owner
Home Financials are based on the most recent Mortgage that was taken out on this home.
Original Mortgage
$814,600
Interest Rate
4.6%
Mortgage Type
Commercial
Create a Home Valuation Report for This Property
The Home Valuation Report is an in-depth analysis detailing your home's value as well as a comparison with similar homes in the area
Home Values in the Area
Average Home Value in this Area
Purchase History
| Date | Buyer | Sale Price | Title Company |
|---|---|---|---|
| Harrington David | -- | Wfg National Title Ins Co | |
| Harrington David | -- | Wfg National Title Ins Co | |
| Harrington David | $1,450,000 | Chicago Title Company | |
| Mio Management | $705,000 | Chicago Title Company |
Source: Public Records
Mortgage History
| Date | Status | Borrower | Loan Amount |
|---|---|---|---|
| Open | Harrington David | $1,046,500 | |
| Closed | Harrington David | $1,087,500 | |
| Previous Owner | Mio Management | $814,600 |
Source: Public Records
Tax History
| Year | Tax Paid | Tax Assessment Tax Assessment Total Assessment is a certain percentage of the fair market value that is determined by local assessors to be the total taxable value of land and additions on the property. | Land | Improvement |
|---|---|---|---|---|
| 2025 | $23,235 | $1,578,763 | $656,178 | $929,585 |
| 2024 | $23,235 | $1,547,675 | $643,314 | $911,361 |
| 2023 | $22,720 | $1,524,196 | $630,702 | $893,494 |
| 2022 | $22,514 | $1,487,312 | $618,336 | $875,976 |
| 2021 | $22,597 | $1,458,022 | $606,216 | $858,806 |
| 2020 | $22,452 | $1,450,000 | $600,000 | $850,000 |
| 2019 | $11,974 | $705,000 | $500,000 | $205,000 |
| 2018 | $3,841 | $47,621 | $23,918 | $23,703 |
| 2017 | $3,676 | $46,687 | $23,449 | $23,238 |
| 2016 | $3,424 | $45,771 | $22,989 | $22,782 |
| 2015 | $3,343 | $45,084 | $22,644 | $22,440 |
| 2014 | $3,201 | $44,200 | $22,200 | $22,000 |
Source: Public Records
Map
Nearby Homes
- 2922 Stanton St
- 1535 Julia St
- 1314 Ashby Ave
- 1507 Prince St
- 2790 Sacramento St
- 3101 Sacramento St
- 2782 Sacramento St
- 2774 Sacramento St
- 2829 California St
- 2758 Sacramento St
- 3032 Mabel St
- 1450 Ward St
- 2750 Sacramento St
- 1237 Ashby Ave
- 3114 California St
- 1646 Ashby Ave
- 3138 California St
- 2717 Mabel St
- 1080 67th St
- 1515 Derby St
- 2907 Stanton St
- 2915 Stanton St
- 2923 Stanton St
- 2925 Stanton St
- 1430 Russell St
- 2924 Sacramento St Unit A
- 2924 Sacramento St
- 2930 Sacramento St
- 1446 Russell St
- 2931 Stanton St Unit D
- 2931 Stanton St
- 2918 Stanton Ave Unit C
- 1416 Russell St
- 2933 Stanton St
- 2920 Stanton St
- 1412 Russell St
- 1408 Russell St
- 2926 Stanton St
- 2907 Dohr St
- 1443 Russell St
Your Personal Tour Guide
Ask me questions while you tour the home.