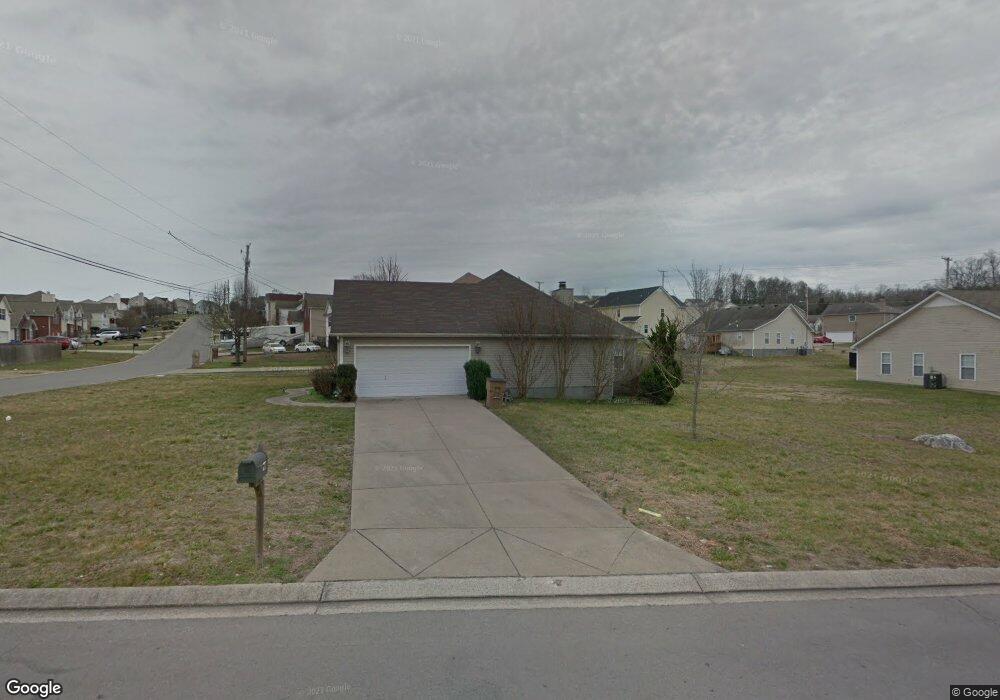
291 Davids Way La Vergne, TN 37086
Estimated Value: $345,773 - $365,000
--
Bed
2
Baths
1,422
Sq Ft
$251/Sq Ft
Est. Value
About This Home
This home is located at 291 Davids Way, La Vergne, TN 37086 and is currently estimated at $356,693, approximately $250 per square foot. 291 Davids Way is a home located in Rutherford County with nearby schools including LaVergne Lake Elementary School, La Vergne Middle School, and Lavergne High School.
Ownership History
Date
Name
Owned For
Owner Type
Purchase Details
Closed on
Oct 6, 2011
Sold by
Federal Home Loan Mortgage Corporation
Bought by
Prewitt Veletra Q
Current Estimated Value
Home Financials for this Owner
Home Financials are based on the most recent Mortgage that was taken out on this home.
Original Mortgage
$109,160
Interest Rate
4.55%
Mortgage Type
FHA
Purchase Details
Closed on
Jun 24, 2011
Sold by
Ivany Helen L
Bought by
Federal Home Loan Mortgage Corporation
Purchase Details
Closed on
Mar 31, 2008
Sold by
Tuck Ricky E
Bought by
Ivany Helen L
Home Financials for this Owner
Home Financials are based on the most recent Mortgage that was taken out on this home.
Original Mortgage
$135,755
Interest Rate
6.22%
Mortgage Type
Purchase Money Mortgage
Purchase Details
Closed on
Dec 31, 2003
Sold by
Classic Homes Bos L P
Bought by
Tuck Ricky E
Home Financials for this Owner
Home Financials are based on the most recent Mortgage that was taken out on this home.
Original Mortgage
$135,403
Interest Rate
5.87%
Create a Home Valuation Report for This Property
The Home Valuation Report is an in-depth analysis detailing your home's value as well as a comparison with similar homes in the area
Home Values in the Area
Average Home Value in this Area
Purchase History
| Date | Buyer | Sale Price | Title Company |
|---|---|---|---|
| Prewitt Veletra Q | $112,000 | -- | |
| Federal Home Loan Mortgage Corporation | $102,600 | -- | |
| Ivany Helen L | $142,900 | -- | |
| Tuck Ricky E | $137,528 | -- |
Source: Public Records
Mortgage History
| Date | Status | Borrower | Loan Amount |
|---|---|---|---|
| Previous Owner | Prewitt Veletra Q | $109,160 | |
| Previous Owner | Tuck Ricky E | $135,755 | |
| Previous Owner | Tuck Ricky E | $135,403 |
Source: Public Records
Tax History Compared to Growth
Tax History
| Year | Tax Paid | Tax Assessment Tax Assessment Total Assessment is a certain percentage of the fair market value that is determined by local assessors to be the total taxable value of land and additions on the property. | Land | Improvement |
|---|---|---|---|---|
| 2025 | $1,649 | $68,350 | $13,750 | $54,600 |
| 2024 | $1,649 | $68,350 | $13,750 | $54,600 |
| 2023 | $1,284 | $68,450 | $13,750 | $54,700 |
| 2022 | $1,106 | $68,450 | $13,750 | $54,700 |
| 2021 | $1,112 | $50,125 | $10,000 | $40,125 |
| 2020 | $1,112 | $50,125 | $10,000 | $40,125 |
| 2019 | $1,112 | $50,125 | $10,000 | $40,125 |
| 2018 | $1,408 | $50,125 | $0 | $0 |
| 2017 | $1,148 | $31,625 | $0 | $0 |
| 2016 | $1,148 | $31,625 | $0 | $0 |
| 2015 | $1,156 | $31,625 | $0 | $0 |
| 2014 | $786 | $31,625 | $0 | $0 |
| 2013 | -- | $31,950 | $0 | $0 |
Source: Public Records
Map
Nearby Homes
- 691 Holland Ridge Dr
- 333 David Bolin Dr
- 728 Holland Ridge Dr
- 221 Quiet Ln
- 151 Ofner Dr
- 108 Ofner Dr
- 327 Delta Way
- 317 Delta Way
- 311 Delta Way
- 305 Delta Way
- 319 Delta Way
- 325 Delta Way
- 307 Delta Way
- 109 David Bolin Dr
- 630 Holland Ridge Dr
- 601 Nixon Way
- 605 Nixon Way
- 544 Stones River Rd
- 8108 Logan Dr
- 1060 Arlene Dr
- 7002 Zither Ln
- 288 Davids's Way
- 287 Davids Way
- 7004 Zither Ln
- 290 Davids Way
- 295 Davids Way
- 1432 E Nir Shreibman Blvd
- 288 Davids Way
- 285 Davids Way
- 292 Davids Way
- 286 Davids Way
- 0 Glochester Ct Unit 1630545
- 0 Glochester Ct Unit RTC1550333
- 0 Glochester Ct Unit RTC1595779
- 0 Glochester Ct Unit RTC1639468
- 0 Glochester Ct Unit RTC1639467
- 0 Glochester Ct
- 286 Davids Way
- 1430 E Nir Shreibman Blvd
- 294 Davids Way