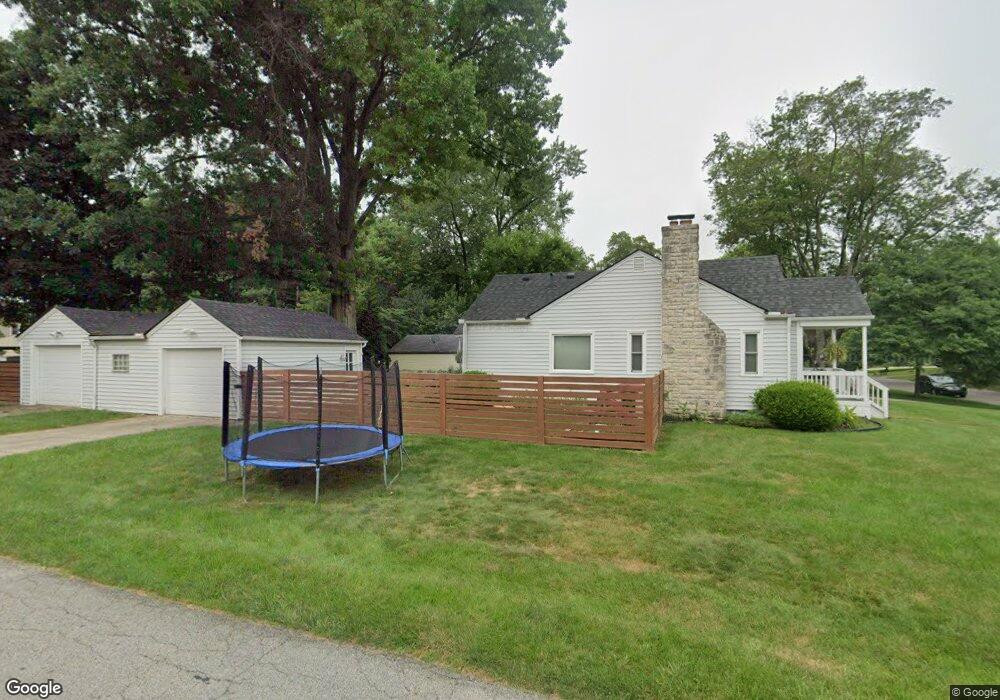
291 E Beechwold Blvd Columbus, OH 43214
Clintonville NeighborhoodEstimated Value: $307,000 - $392,000
3
Beds
2
Baths
1,400
Sq Ft
$260/Sq Ft
Est. Value
About This Home
This home is located at 291 E Beechwold Blvd, Columbus, OH 43214 and is currently estimated at $364,112, approximately $260 per square foot. 291 E Beechwold Blvd is a home located in Franklin County with nearby schools including Indian Springs Elementary School, Dominion Middle School, and Whetstone High School.
Ownership History
Date
Name
Owned For
Owner Type
Purchase Details
Closed on
Dec 16, 2011
Sold by
1St National Cash Refund Inc
Bought by
Bowers Allison M
Current Estimated Value
Home Financials for this Owner
Home Financials are based on the most recent Mortgage that was taken out on this home.
Original Mortgage
$153,424
Outstanding Balance
$102,079
Interest Rate
3.75%
Mortgage Type
FHA
Estimated Equity
$262,033
Purchase Details
Closed on
Oct 12, 2010
Sold by
Bossert Marjory L and Estate Of John L Bossert
Bought by
1St National Cash Refund Inc
Purchase Details
Closed on
Apr 13, 2007
Sold by
Bossert Jennifer C
Bought by
Bossert John L
Purchase Details
Closed on
Jun 3, 1993
Bought by
Bossert John L
Purchase Details
Closed on
Oct 1, 1991
Purchase Details
Closed on
Jun 1, 1983
Create a Home Valuation Report for This Property
The Home Valuation Report is an in-depth analysis detailing your home's value as well as a comparison with similar homes in the area
Home Values in the Area
Average Home Value in this Area
Purchase History
| Date | Buyer | Sale Price | Title Company |
|---|---|---|---|
| Bowers Allison M | $159,900 | Capcity Title | |
| 1St National Cash Refund Inc | $68,000 | Attorney | |
| Bossert John L | -- | Attorney | |
| Bossert John L | $79,200 | -- | |
| -- | $75,000 | -- | |
| -- | $49,000 | -- |
Source: Public Records
Mortgage History
| Date | Status | Borrower | Loan Amount |
|---|---|---|---|
| Open | Bowers Allison M | $153,424 |
Source: Public Records
Tax History
| Year | Tax Paid | Tax Assessment Tax Assessment Total Assessment is a certain percentage of the fair market value that is determined by local assessors to be the total taxable value of land and additions on the property. | Land | Improvement |
|---|---|---|---|---|
| 2025 | $4,728 | $105,350 | $52,850 | $52,500 |
| 2024 | $4,728 | $105,350 | $52,850 | $52,500 |
| 2023 | $4,668 | $105,350 | $52,850 | $52,500 |
| 2022 | $5,085 | $98,040 | $49,280 | $48,760 |
| 2021 | $5,094 | $98,040 | $49,280 | $48,760 |
| 2020 | $5,100 | $98,040 | $49,280 | $48,760 |
| 2019 | $4,604 | $75,890 | $37,910 | $37,980 |
| 2018 | $4,033 | $75,890 | $37,910 | $37,980 |
| 2017 | $4,213 | $75,890 | $37,910 | $37,980 |
| 2016 | $3,826 | $57,750 | $26,950 | $30,800 |
| 2015 | $3,473 | $57,750 | $26,950 | $30,800 |
| 2014 | $3,481 | $57,750 | $26,950 | $30,800 |
| 2013 | $1,677 | $56,385 | $25,655 | $30,730 |
Source: Public Records
Map
Nearby Homes
- 289 E Royal Forest Blvd
- 312 E Royal Forest Blvd
- 327 E Jeffrey Place
- 420 E Beechwold Blvd
- 140 E Beechwold Blvd
- 387 Morse Rd
- 522 E Beechwold Blvd
- 528 E Beechwold Blvd
- 151 W Dominion Blvd
- 243 E Schreyer Place
- 109 W Schreyer Place
- 4605 Glenmawr Ave
- 4615 Glenmawr Ave
- 211 Garrett Place
- 262 Leland Ave
- 4596 Glenmawr Ave
- 139 Aldrich Rd
- 205 W Henderson Rd
- 4231 Glenmawr Ave Unit 233
- 33 Rosslyn Ave
- 283 E Beechwold Blvd
- 279 E Beechwold Blvd
- 305 E Beechwold Blvd
- 273 E Beechwold Blvd
- 311 E Beechwold Blvd
- 294 Wetmore Rd
- 267 E Beechwold Blvd
- 286 Wetmore Rd
- 290 E Beechwold Blvd
- 296 E Beechwold Blvd
- 317 E Beechwold Blvd
- 286 E Beechwold Blvd
- 280 Wetmore Rd
- 280 E Beechwold Blvd
- 308 Wetmore Rd
- 306 E Beechwold Blvd
- 263 E Beechwold Blvd
- 272 Wetmore Rd
- 312 E Beechwold Blvd
- 274 E Beechwold Blvd
Your Personal Tour Guide
Ask me questions while you tour the home.