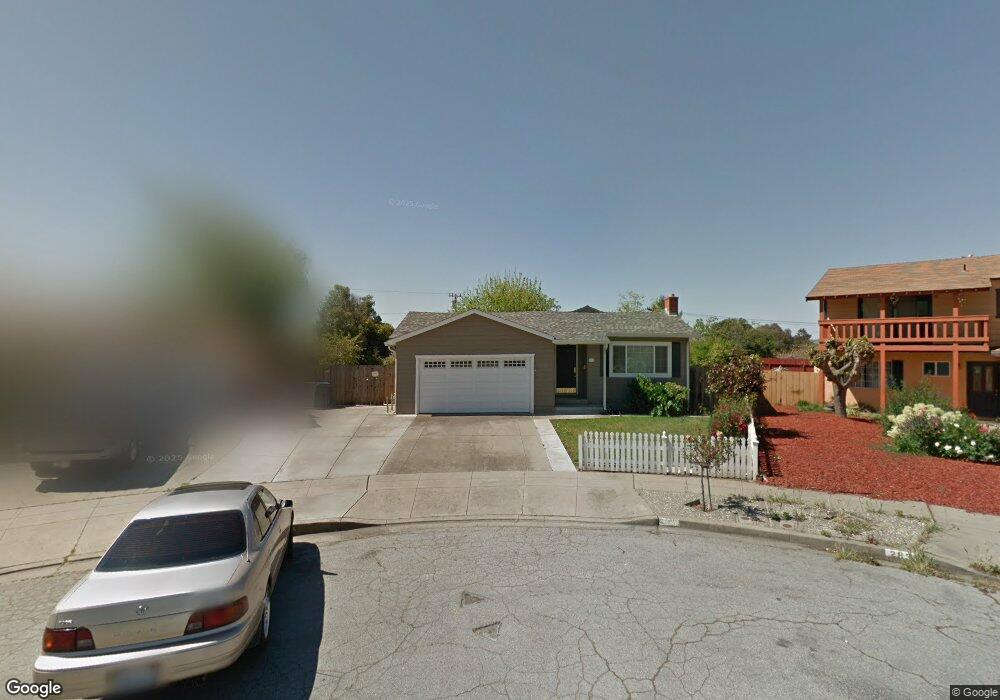
291 Fernald Ct Fremont, CA 94539
Warm Springs NeighborhoodEstimated Value: $1,707,000 - $1,950,000
3
Beds
2
Baths
1,614
Sq Ft
$1,153/Sq Ft
Est. Value
About This Home
This home is located at 291 Fernald Ct, Fremont, CA 94539 and is currently estimated at $1,861,034, approximately $1,153 per square foot. 291 Fernald Ct is a home located in Alameda County with nearby schools including Warm Springs Elementary School, James Leitch Elementary School, and John M. Horner Junior High School.
Ownership History
Date
Name
Owned For
Owner Type
Purchase Details
Closed on
May 10, 2023
Sold by
Hanna Salim
Bought by
Hanna Family Trust and Hanna
Current Estimated Value
Purchase Details
Closed on
Mar 17, 2004
Sold by
Matz Arnold W and Matz Michelle A
Bought by
Hanna Salim and Hanna Maha
Home Financials for this Owner
Home Financials are based on the most recent Mortgage that was taken out on this home.
Original Mortgage
$428,000
Interest Rate
4.12%
Mortgage Type
Purchase Money Mortgage
Purchase Details
Closed on
Apr 10, 2002
Sold by
Matz Arnold W and Matz Michelle A
Bought by
Matz Arnold W and Matz Michelle A
Home Financials for this Owner
Home Financials are based on the most recent Mortgage that was taken out on this home.
Original Mortgage
$300,700
Interest Rate
6.87%
Mortgage Type
Balloon
Purchase Details
Closed on
Apr 12, 1995
Sold by
Flores Arturo L
Bought by
Matz Arnold W and Matz Michelle A
Home Financials for this Owner
Home Financials are based on the most recent Mortgage that was taken out on this home.
Original Mortgage
$199,500
Interest Rate
8.6%
Mortgage Type
Construction
Create a Home Valuation Report for This Property
The Home Valuation Report is an in-depth analysis detailing your home's value as well as a comparison with similar homes in the area
Home Values in the Area
Average Home Value in this Area
Purchase History
| Date | Buyer | Sale Price | Title Company |
|---|---|---|---|
| Hanna Family Trust | -- | None Listed On Document | |
| Hanna Salim | $535,000 | Chicago Title Company | |
| Matz Arnold W | -- | American Title Co | |
| Matz Arnold W | $210,000 | Placer Title Company |
Source: Public Records
Mortgage History
| Date | Status | Borrower | Loan Amount |
|---|---|---|---|
| Previous Owner | Hanna Salim | $428,000 | |
| Previous Owner | Matz Arnold W | $300,700 | |
| Previous Owner | Matz Arnold W | $199,500 |
Source: Public Records
Tax History Compared to Growth
Tax History
| Year | Tax Paid | Tax Assessment Tax Assessment Total Assessment is a certain percentage of the fair market value that is determined by local assessors to be the total taxable value of land and additions on the property. | Land | Improvement |
|---|---|---|---|---|
| 2025 | $9,274 | $760,614 | $228,184 | $532,430 |
| 2024 | $9,274 | $745,704 | $223,711 | $521,993 |
| 2023 | $9,024 | $731,081 | $219,324 | $511,757 |
| 2022 | $8,905 | $716,750 | $215,025 | $501,725 |
| 2021 | $8,688 | $702,700 | $210,810 | $491,890 |
| 2020 | $8,703 | $695,500 | $208,650 | $486,850 |
| 2019 | $8,605 | $681,861 | $204,558 | $477,303 |
| 2018 | $8,438 | $668,492 | $200,547 | $467,945 |
| 2017 | $8,228 | $655,384 | $196,615 | $458,769 |
| 2016 | $8,088 | $642,534 | $192,760 | $449,774 |
| 2015 | $7,980 | $632,883 | $189,865 | $443,018 |
| 2014 | $7,842 | $620,487 | $186,146 | $434,341 |
Source: Public Records
Map
Nearby Homes
- 47236 Cavanaugh Common
- 281 Hackamore Common
- 47222 Mission Falls Ct
- 136 Hackamore Ln Unit 18
- 114 Hackamore Ln Unit 14
- 524 E Warren Ave
- 472 Mayten Way
- 46869 Fernald Common Unit 38
- 46762 Winema Common
- 296 Kansas Way
- 46935 Aloe Ct
- 270 Tuolumne Dr
- 46925 Aloe Ct
- 145 Gamma Grass Terrace Unit U256
- 514 Bristle Grass Terrace
- 45897 Bridgeport Place
- 130 Kootenai Dr
- 49002 Cinnamon Fern Common Unit 311
- 49100 Tomahawk Place
- 391 Gross St
- 290 Fernald Ct
- 283 Fernald Ct
- 246 Addison Ct
- 234 Addison Ct
- 249 Merrill Ave
- 276 Lippert Ave
- 257 Merrill Ave
- 250 Addison Ct
- 241 Merrill Ave
- 222 Addison Ct
- 265 Merrill Ave
- 260 Lippert Ave
- 274 Fernald Ct
- 233 Merrill Ave
- 273 Merrill Ave
- 210 Addison Ct
- 225 Merrill Ave
- 247 Addison Ct
- 312 Lippert Ave
- 281 Merrill Ave