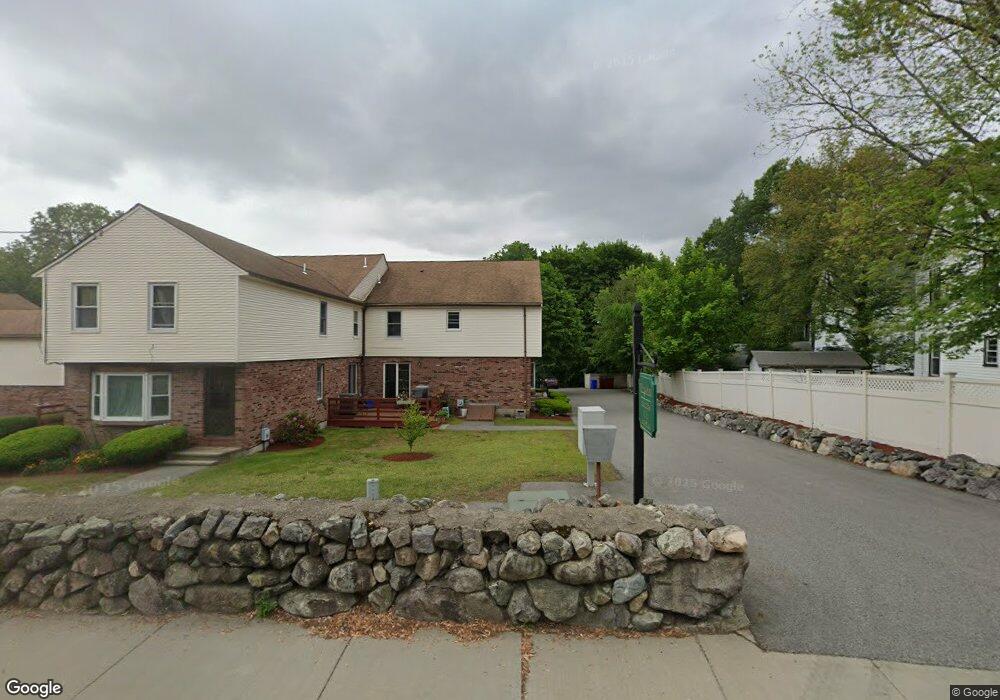
291 Grove St Unit 3 West Roxbury, MA 02132
Upper Washington-Spring Street NeighborhoodEstimated Value: $480,030 - $634,000
2
Beds
2
Baths
1,428
Sq Ft
$391/Sq Ft
Est. Value
About This Home
This home is located at 291 Grove St Unit 3, West Roxbury, MA 02132 and is currently estimated at $557,758, approximately $390 per square foot. 291 Grove St Unit 3 is a home located in Suffolk County with nearby schools including Catholic Memorial School.
Ownership History
Date
Name
Owned For
Owner Type
Purchase Details
Closed on
Aug 23, 2010
Sold by
Foo Conrad C
Bought by
Foo Conrad C and Ong Katherine
Current Estimated Value
Purchase Details
Closed on
Sep 29, 2003
Sold by
Perry Elizabeth D
Bought by
Foo Conrad C
Home Financials for this Owner
Home Financials are based on the most recent Mortgage that was taken out on this home.
Original Mortgage
$224,000
Interest Rate
6.29%
Mortgage Type
Purchase Money Mortgage
Purchase Details
Closed on
Aug 29, 2002
Sold by
Blaisdell Ellen
Bought by
Perry Elizabeth D
Purchase Details
Closed on
Jul 31, 2000
Sold by
Bernstein David P and Sorgi Donna
Bought by
Blaisdell Ellen
Purchase Details
Closed on
Jul 1, 1994
Sold by
Cronin Mary A and Cronin Dennis
Bought by
Diehl Jeanne M and Diehl Thomas L
Purchase Details
Closed on
Dec 23, 1993
Sold by
Hickinbottom Philip J and Hickinbottom Mgt M
Bought by
Audley Christine A
Purchase Details
Closed on
Nov 27, 1990
Sold by
Berard Germaine A
Bought by
Neill Mary D
Create a Home Valuation Report for This Property
The Home Valuation Report is an in-depth analysis detailing your home's value as well as a comparison with similar homes in the area
Home Values in the Area
Average Home Value in this Area
Purchase History
| Date | Buyer | Sale Price | Title Company |
|---|---|---|---|
| Foo Conrad C | -- | -- | |
| Foo Conrad C | $280,000 | -- | |
| Perry Elizabeth D | $287,000 | -- | |
| Blaisdell Ellen | $179,000 | -- | |
| Diehl Jeanne M | $101,000 | -- | |
| Audley Christine A | $88,500 | -- | |
| Neill Mary D | $10,000 | -- |
Source: Public Records
Mortgage History
| Date | Status | Borrower | Loan Amount |
|---|---|---|---|
| Previous Owner | Neill Mary D | $224,000 |
Source: Public Records
Tax History Compared to Growth
Tax History
| Year | Tax Paid | Tax Assessment Tax Assessment Total Assessment is a certain percentage of the fair market value that is determined by local assessors to be the total taxable value of land and additions on the property. | Land | Improvement |
|---|---|---|---|---|
| 2025 | $3,914 | $338,000 | $0 | $338,000 |
| 2024 | $3,072 | $281,800 | $0 | $281,800 |
| 2023 | $2,880 | $268,200 | $0 | $268,200 |
| 2022 | $2,725 | $250,500 | $0 | $250,500 |
| 2021 | $2,546 | $238,600 | $0 | $238,600 |
| 2020 | $2,506 | $237,300 | $0 | $237,300 |
| 2019 | $2,226 | $211,200 | $0 | $211,200 |
| 2018 | $2,213 | $211,200 | $0 | $211,200 |
| 2017 | $2,192 | $207,000 | $0 | $207,000 |
| 2016 | $2,169 | $197,200 | $0 | $197,200 |
| 2015 | $2,562 | $211,600 | $0 | $211,600 |
| 2014 | $2,508 | $199,400 | $0 | $199,400 |
Source: Public Records
Map
Nearby Homes
- 70 Birchwood St
- 25R Rockland St Unit 6
- 94 Rockland St
- 11 Cheriton Rd Unit 102B
- 150 Grove St
- 235 Curve St
- 83 Mount Hope St
- 115 Grove St Unit 11
- 111 Grove St Unit 6
- 199 Glenellen Rd
- 191 Glenellen Rd
- 55 Cottage Rd
- 69 Berlin St
- 45 Weymouth Ave
- 110 New Haven St
- 4975 Washington St Unit 306
- 4975 Washington St Unit 311
- 19 Lewis Ln
- 4959 Washington St
- 10 Starling St
- 289 Grove St Unit 2
- 287 Grove St Unit 1
- 295 Grove St Unit 5
- 293 Grove St Unit 4
- 295 Grove St Unit 295
- 293 Grove St Unit 293
- 297 Grove St Unit 6
- 297 Grove St Unit 297
- 303 Grove St Unit 9
- 301 Grove St Unit 8
- 299 Grove St Unit 7
- 4 Stimson St
- 301 Grove St Unit 1
- 301 Grove St Unit 301 Grove Street
- 301 Grove St
- 303 Grove St Unit 9,303
- 303 Grove St Unit 303
- 309 Grove St Unit 12
- 8 Stimson St
- 307 Grove St Unit 11