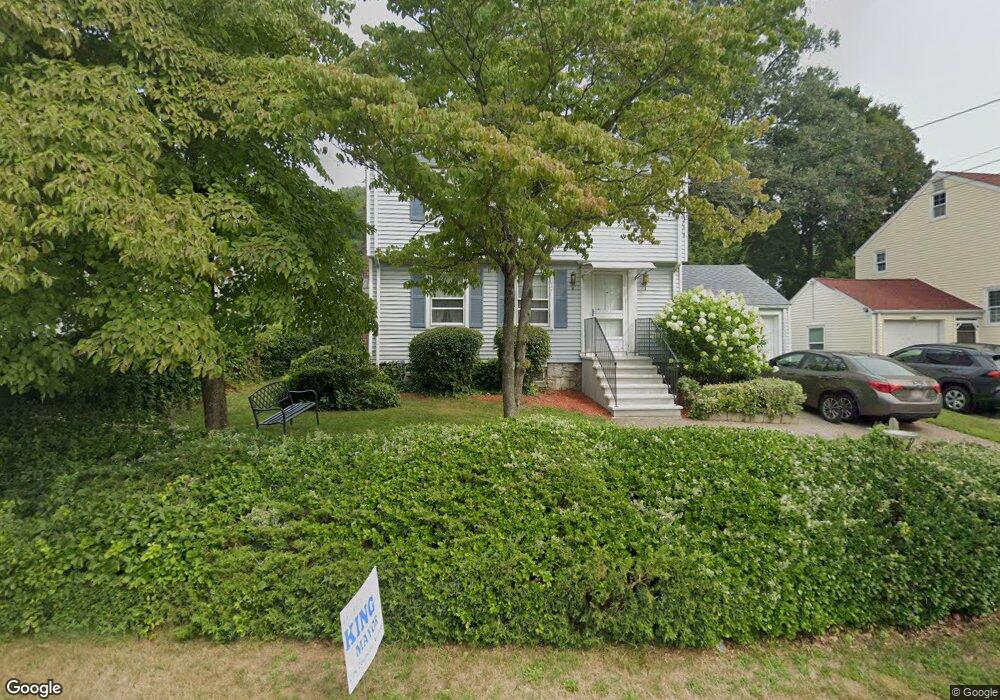
291 June St Worcester, MA 01602
Tatnuck NeighborhoodEstimated Value: $407,000 - $437,000
3
Beds
2
Baths
1,327
Sq Ft
$315/Sq Ft
Est. Value
About This Home
This home is located at 291 June St, Worcester, MA 01602 and is currently estimated at $417,501, approximately $314 per square foot. 291 June St is a home located in Worcester County with nearby schools including Chandler Magnet, Jacob Hiatt Magnet School, and May Street Elementary School.
Ownership History
Date
Name
Owned For
Owner Type
Purchase Details
Closed on
Jul 1, 2009
Sold by
Fish Timothy J and Fish Judith M
Bought by
Humphrey Catherine M and Sthelaire John F
Current Estimated Value
Home Financials for this Owner
Home Financials are based on the most recent Mortgage that was taken out on this home.
Original Mortgage
$140,000
Outstanding Balance
$88,503
Interest Rate
4.86%
Mortgage Type
Purchase Money Mortgage
Estimated Equity
$328,998
Purchase Details
Closed on
Feb 5, 2008
Sold by
Smith Robert C
Bought by
Smith Judith M and Smith Robert C
Create a Home Valuation Report for This Property
The Home Valuation Report is an in-depth analysis detailing your home's value as well as a comparison with similar homes in the area
Home Values in the Area
Average Home Value in this Area
Purchase History
| Date | Buyer | Sale Price | Title Company |
|---|---|---|---|
| Humphrey Catherine M | $155,000 | -- | |
| Smith Judith M | -- | -- |
Source: Public Records
Mortgage History
| Date | Status | Borrower | Loan Amount |
|---|---|---|---|
| Open | Humphrey Catherine M | $140,000 |
Source: Public Records
Tax History
| Year | Tax Paid | Tax Assessment Tax Assessment Total Assessment is a certain percentage of the fair market value that is determined by local assessors to be the total taxable value of land and additions on the property. | Land | Improvement |
|---|---|---|---|---|
| 2025 | $4,353 | $330,000 | $110,900 | $219,100 |
| 2024 | $4,285 | $311,600 | $110,900 | $200,700 |
| 2023 | $4,097 | $285,700 | $96,400 | $189,300 |
| 2022 | $3,757 | $247,000 | $77,200 | $169,800 |
| 2021 | $3,547 | $217,900 | $61,700 | $156,200 |
| 2020 | $3,458 | $203,400 | $61,700 | $141,700 |
| 2019 | $3,325 | $184,700 | $55,500 | $129,200 |
| 2018 | $3,317 | $175,400 | $55,500 | $119,900 |
| 2017 | $3,204 | $166,700 | $55,500 | $111,200 |
| 2016 | $3,141 | $152,400 | $41,500 | $110,900 |
| 2015 | $3,059 | $152,400 | $41,500 | $110,900 |
| 2014 | $2,978 | $152,400 | $41,500 | $110,900 |
Source: Public Records
Map
Nearby Homes
- 6 Ludington Rd
- 34 Rosslare Dr Unit 108
- 5 Swan Ave
- 22 Outlook Dr
- 32 Zenith Dr
- 415 Mill St
- 57 1st St
- 34 Scandinavia Ave
- 16 Sherwood Rd
- 33 Carlisle St
- 47R Yarnie Unit 3A
- 47R Yarnie Unit 1B
- 47R Yarnie Unit 2B
- 47R Yarnie Unit 4B
- 47R Yarnie Unit 8B
- 47R Yarnie Unit 5A
- 47R Yarnie Unit 6B
- 47R Yarnie Unit 4A
- 47R Yarnie Unit 1A
- 47R Yarnie Unit 9
Your Personal Tour Guide
Ask me questions while you tour the home.