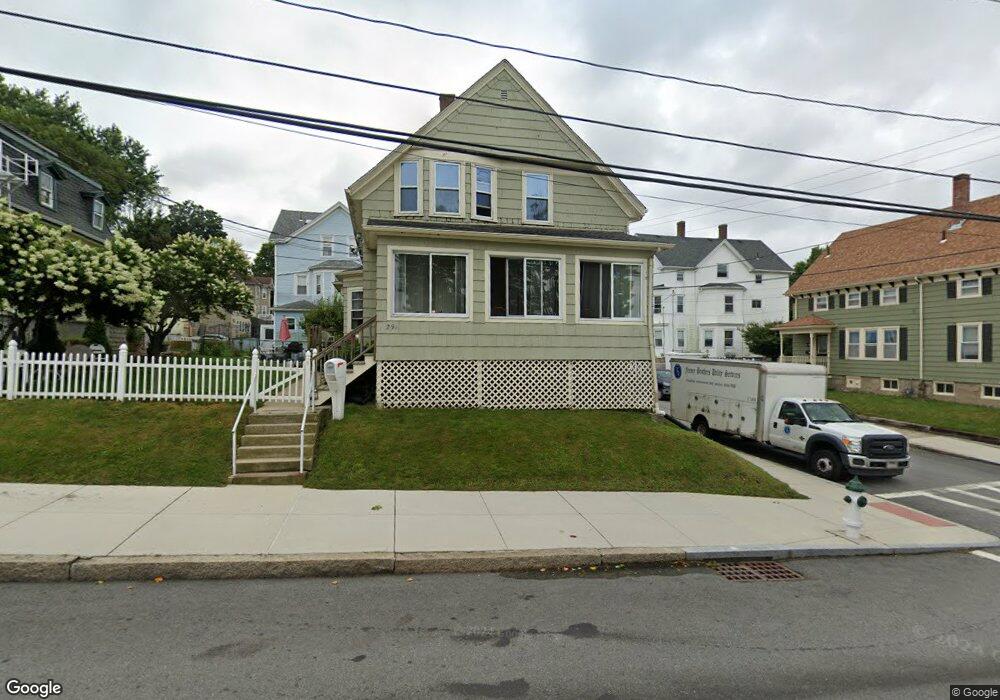
291 Middle St Fall River, MA 02724
Sandy Beach NeighborhoodEstimated Value: $402,736 - $487,000
4
Beds
2
Baths
1,575
Sq Ft
$287/Sq Ft
Est. Value
About This Home
This home is located at 291 Middle St, Fall River, MA 02724 and is currently estimated at $452,684, approximately $287 per square foot. 291 Middle St is a home located in Bristol County with nearby schools including Carlton M. Viveiros Elementary School, Matthew J. Kuss Middle School, and B M C Durfee High School.
Ownership History
Date
Name
Owned For
Owner Type
Purchase Details
Closed on
Jan 7, 2019
Sold by
Ash Rt and 5 Star Prop Mgmt Llc Tr
Bought by
Reis Ricardo J and Reis Renata M
Current Estimated Value
Home Financials for this Owner
Home Financials are based on the most recent Mortgage that was taken out on this home.
Original Mortgage
$220,924
Outstanding Balance
$192,759
Interest Rate
4.62%
Mortgage Type
FHA
Estimated Equity
$259,925
Purchase Details
Closed on
Oct 16, 2006
Sold by
Carrigg John P and Carrigg E R
Bought by
5 Star Prop Mgmt Llc
Purchase Details
Closed on
Sep 30, 1987
Sold by
Budd Louise C
Bought by
Carrigg John P
Create a Home Valuation Report for This Property
The Home Valuation Report is an in-depth analysis detailing your home's value as well as a comparison with similar homes in the area
Home Values in the Area
Average Home Value in this Area
Purchase History
| Date | Buyer | Sale Price | Title Company |
|---|---|---|---|
| Reis Ricardo J | $225,000 | -- | |
| 5 Star Prop Mgmt Llc | -- | -- | |
| 5 Star Prop Mgmt Llc | -- | -- | |
| Carrigg John P | $80,000 | -- |
Source: Public Records
Mortgage History
| Date | Status | Borrower | Loan Amount |
|---|---|---|---|
| Open | Reis Ricardo J | $220,924 | |
| Closed | Reis Ricardo J | $220,924 | |
| Previous Owner | Carrigg John P | $150,000 | |
| Closed | Carrigg John P | $0 |
Source: Public Records
Tax History
| Year | Tax Paid | Tax Assessment Tax Assessment Total Assessment is a certain percentage of the fair market value that is determined by local assessors to be the total taxable value of land and additions on the property. | Land | Improvement |
|---|---|---|---|---|
| 2025 | $3,991 | $348,600 | $106,700 | $241,900 |
| 2024 | $3,670 | $319,400 | $102,800 | $216,600 |
| 2023 | $3,334 | $271,700 | $84,900 | $186,800 |
| 2022 | $3,096 | $245,300 | $80,900 | $164,400 |
| 2021 | $2,882 | $208,400 | $77,000 | $131,400 |
| 2020 | $2,643 | $182,900 | $75,800 | $107,100 |
| 2019 | $2,508 | $172,000 | $73,000 | $99,000 |
| 2018 | $2,484 | $169,900 | $79,100 | $90,800 |
| 2017 | $2,255 | $161,100 | $75,400 | $85,700 |
| 2016 | $2,233 | $163,800 | $80,200 | $83,600 |
| 2015 | $2,201 | $168,300 | $80,200 | $88,100 |
| 2014 | $2,186 | $173,800 | $77,800 | $96,000 |
Source: Public Records
Map
Nearby Homes
- 70 Brown St
- 700 Shore Dr Unit 6-604
- 700 Shore Dr Unit 1205
- 700 Shore Dr Unit 810
- 420 Bradford Ave
- 303 Eagle St Unit C
- 403 Division St Unit 13
- 403 Division St Unit 5
- 403 Division St Unit 9
- 403 Division St Unit 11
- 403 Division St Unit 12
- 403 Division St Unit 1
- 403 Division St Unit 18
- 334 Fountain St
- 315 William St
- 327 William St
- 330 William St
- 271 Mulberry St
- 1273-1279 S Main St
- 169 Grant St
Your Personal Tour Guide
Ask me questions while you tour the home.