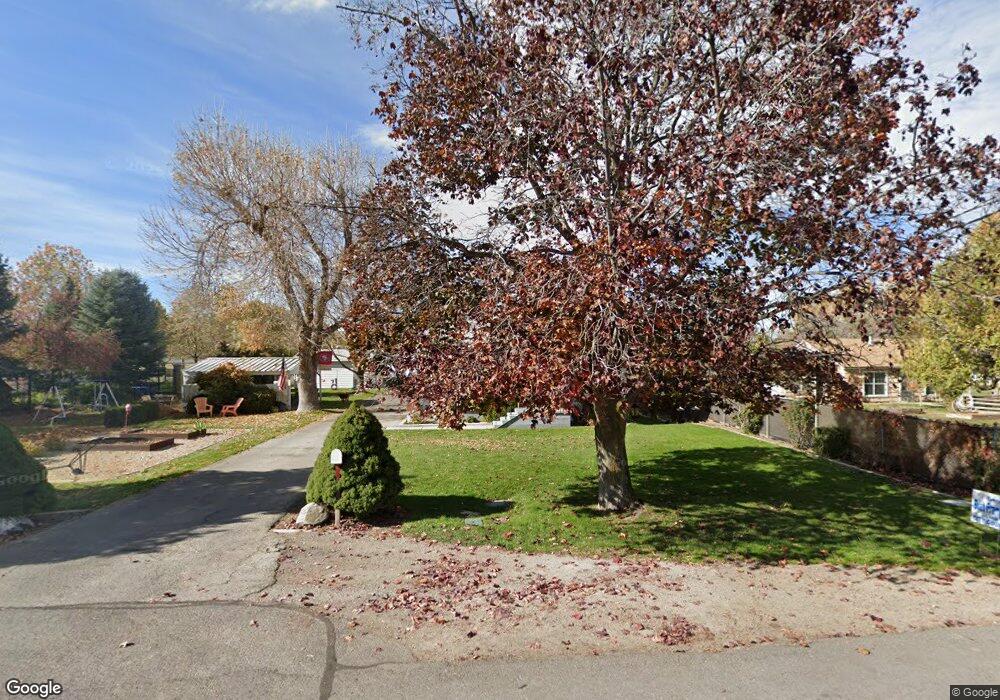
291 N 400 E Lindon, UT 84042
Estimated Value: $507,000 - $648,000
2
Beds
1
Bath
1,008
Sq Ft
$583/Sq Ft
Est. Value
About This Home
This home is located at 291 N 400 E, Lindon, UT 84042 and is currently estimated at $587,861, approximately $583 per square foot. 291 N 400 E is a home located in Utah County with nearby schools including Lindon Elementary School, Oak Canyon Junior High School, and Pleasant Grove High School.
Ownership History
Date
Name
Owned For
Owner Type
Purchase Details
Closed on
Jun 14, 2007
Sold by
Bylund Properties Llc
Bought by
Bylund Rodney J
Current Estimated Value
Purchase Details
Closed on
Jul 20, 2006
Sold by
Atkinson Julie C and Cargill Family Trust
Bought by
Bylund Properties Llc
Create a Home Valuation Report for This Property
The Home Valuation Report is an in-depth analysis detailing your home's value as well as a comparison with similar homes in the area
Home Values in the Area
Average Home Value in this Area
Purchase History
| Date | Buyer | Sale Price | Title Company |
|---|---|---|---|
| Bylund Rodney J | -- | Security Title & Abstract | |
| Bylund Properties Llc | -- | Security Title & Abstract | |
| Bylund Properties Llc | -- | Security Title & Abstract | |
| Bylund Properties Llc | -- | Security Title & Abstract |
Source: Public Records
Tax History
| Year | Tax Paid | Tax Assessment Tax Assessment Total Assessment is a certain percentage of the fair market value that is determined by local assessors to be the total taxable value of land and additions on the property. | Land | Improvement |
|---|---|---|---|---|
| 2025 | $2,018 | $269,665 | -- | -- |
| 2024 | $2,018 | $248,765 | $0 | $0 |
| 2023 | $1,899 | $251,515 | $0 | $0 |
| 2022 | $1,954 | $249,920 | $0 | $0 |
| 2021 | $1,593 | $307,200 | $198,200 | $109,000 |
| 2020 | $1,474 | $279,800 | $177,000 | $102,800 |
| 2019 | $1,285 | $254,500 | $151,700 | $102,800 |
| 2018 | $1,201 | $224,200 | $134,800 | $89,400 |
| 2017 | $1,116 | $111,760 | $0 | $0 |
| 2016 | $1,062 | $98,340 | $0 | $0 |
| 2015 | $1,060 | $92,785 | $0 | $0 |
| 2014 | $907 | $78,705 | $0 | $0 |
Source: Public Records
Map
Nearby Homes
Your Personal Tour Guide
Ask me questions while you tour the home.