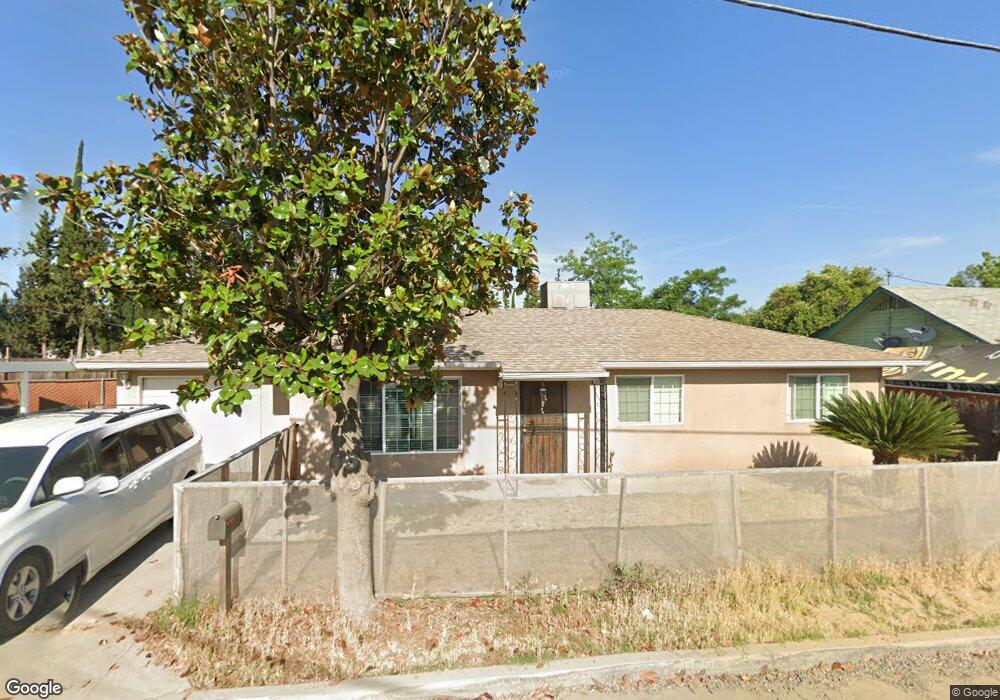
291 N Euclid Ave Dinuba, CA 93618
Estimated Value: $266,000 - $287,000
3
Beds
2
Baths
1,075
Sq Ft
$259/Sq Ft
Est. Value
About This Home
This home is located at 291 N Euclid Ave, Dinuba, CA 93618 and is currently estimated at $278,926, approximately $259 per square foot. 291 N Euclid Ave is a home located in Tulare County with nearby schools including Roosevelt Elementary School, Washington Intermediate School, and Dinuba High School.
Ownership History
Date
Name
Owned For
Owner Type
Purchase Details
Closed on
Jan 12, 2024
Sold by
Serrano Arturo and Serrano Veronica
Bought by
Granados Manzo Yaneth and Osornio Rojas Bernabe
Current Estimated Value
Home Financials for this Owner
Home Financials are based on the most recent Mortgage that was taken out on this home.
Original Mortgage
$8,592
Interest Rate
7.03%
Mortgage Type
New Conventional
Purchase Details
Closed on
Jan 26, 2021
Sold by
Singh Sukhwinder and Kaur Kulwinder
Bought by
Serrano Arturo and Serrano Veronica
Purchase Details
Closed on
Oct 21, 2016
Sold by
Morales Melanie
Bought by
Singh Sukhwinder and Kaur Kulwinder
Home Financials for this Owner
Home Financials are based on the most recent Mortgage that was taken out on this home.
Original Mortgage
$88,000
Interest Rate
3.57%
Mortgage Type
New Conventional
Purchase Details
Closed on
Aug 1, 2011
Sold by
Martinez Mary
Bought by
Martinez Mary and Morales Melanie
Create a Home Valuation Report for This Property
The Home Valuation Report is an in-depth analysis detailing your home's value as well as a comparison with similar homes in the area
Home Values in the Area
Average Home Value in this Area
Purchase History
| Date | Buyer | Sale Price | Title Company |
|---|---|---|---|
| Granados Manzo Yaneth | $250,000 | Chicago Title | |
| Serrano Arturo | $170,000 | Chicago Title | |
| Singh Sukhwinder | $110,000 | Chicago Title Company | |
| Martinez Mary | -- | None Available | |
| Martinez Mary | -- | None Available |
Source: Public Records
Mortgage History
| Date | Status | Borrower | Loan Amount |
|---|---|---|---|
| Closed | Granados Manzo Yaneth | $8,592 | |
| Open | Granados Manzo Yaneth | $245,471 | |
| Previous Owner | Singh Sukhwinder | $88,000 |
Source: Public Records
Tax History Compared to Growth
Tax History
| Year | Tax Paid | Tax Assessment Tax Assessment Total Assessment is a certain percentage of the fair market value that is determined by local assessors to be the total taxable value of land and additions on the property. | Land | Improvement |
|---|---|---|---|---|
| 2025 | $1,939 | $255,000 | $69,360 | $185,640 |
| 2024 | $1,939 | $180,405 | $42,448 | $137,957 |
| 2023 | $1,997 | $176,868 | $41,616 | $135,252 |
| 2022 | $1,902 | $173,400 | $40,800 | $132,600 |
| 2021 | $1,296 | $117,943 | $42,888 | $75,055 |
| 2020 | $1,308 | $116,733 | $42,448 | $74,285 |
| 2019 | $1,343 | $114,444 | $41,616 | $72,828 |
| 2018 | $1,282 | $112,200 | $40,800 | $71,400 |
| 2017 | $484 | $41,178 | $4,218 | $36,960 |
| 2016 | $468 | $40,370 | $4,135 | $36,235 |
| 2015 | $447 | $39,764 | $4,073 | $35,691 |
| 2014 | $447 | $38,985 | $3,993 | $34,992 |
Source: Public Records
Map
Nearby Homes
- 0 Avenue 424
- 616 W Bloomingdale Ave
- 1266 N Skye St Unit Mb90
- 0 Road 80
- 333 N L St
- 784/784a N Lillie Ave
- 976 Daisy Ct
- 1177 Timothy Ave
- 225 W Tulare St
- 0 S Alta Ave
- Savannah Plan at Empire Ranch
- Charlotte Plan at Empire Ranch
- Raleigh Plan at Empire Ranch
- Lexington Plan at Empire Ranch
- Elise Plan at Empire Ranch
- Monreau Plan at Empire Ranch
- 223 N H St
- 299 Alder St
- 375 Amber Ln
- 397 Amber Ln
- 293 N Euclid Ave
- 319 N Euclid Ave
- 493 W Franklin Way
- 488 W Adelaide Way
- 525 W El Monte Way
- 481 W Franklin Way
- 375 N Euclid Ave
- 469 W Franklin Way
- 458 W Adelaide Way
- 455 W Franklin Way
- 360 N Euclid Ave
- 480 W Franklin Way
- 446 W Adelaide Way
- 477 W Adelaide Way
- 517 W El Monte Way
- 597 W El Monte Way
- 449 W Franklin Way
- 391 N Euclid Ave
- 465 W Adelaide Way
- 454 W Franklin Way