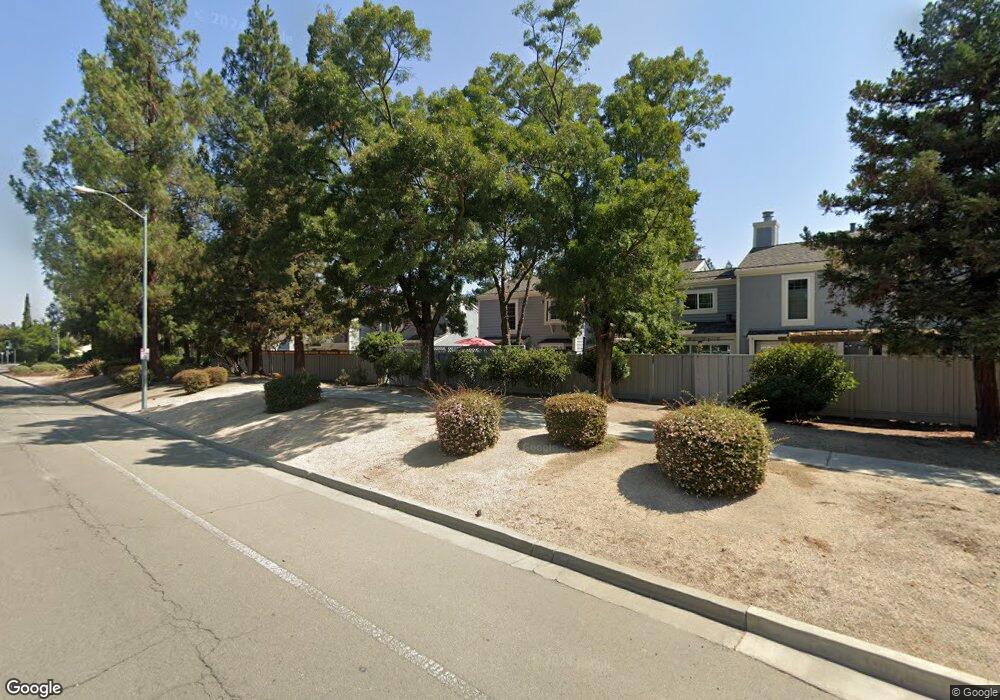
291 Northwood Commons Livermore, CA 94551
Downtown Livermore NeighborhoodEstimated Value: $749,939 - $821,000
3
Beds
3
Baths
1,260
Sq Ft
$620/Sq Ft
Est. Value
About This Home
This home is located at 291 Northwood Commons, Livermore, CA 94551 and is currently estimated at $780,735, approximately $619 per square foot. 291 Northwood Commons is a home located in Alameda County with nearby schools including Marylin Avenue Elementary School, Junction Avenue K-8 School, and Granada High School.
Ownership History
Date
Name
Owned For
Owner Type
Purchase Details
Closed on
Mar 17, 2010
Sold by
Sheldon Gary M and Sheldon Vitoria B
Bought by
Kutil Craig
Current Estimated Value
Home Financials for this Owner
Home Financials are based on the most recent Mortgage that was taken out on this home.
Original Mortgage
$245,000
Outstanding Balance
$161,568
Interest Rate
4.88%
Mortgage Type
New Conventional
Estimated Equity
$619,167
Purchase Details
Closed on
Jan 17, 2008
Sold by
Sheldon Gary M and Sheldon Victoria
Bought by
Sheldon Gary M and Sheldon Victoria B
Purchase Details
Closed on
Sep 27, 2000
Sold by
Flynn Clay C and Flynn Mahammad
Bought by
Sheldon Gary M and Sheldon Victoria
Purchase Details
Closed on
Nov 23, 1998
Sold by
Flynn Razia
Bought by
Flynn Clay
Home Financials for this Owner
Home Financials are based on the most recent Mortgage that was taken out on this home.
Original Mortgage
$199,365
Interest Rate
6.86%
Mortgage Type
FHA
Purchase Details
Closed on
Mar 4, 1995
Sold by
Burks Odell
Bought by
Pinkard Thetius L
Create a Home Valuation Report for This Property
The Home Valuation Report is an in-depth analysis detailing your home's value as well as a comparison with similar homes in the area
Home Values in the Area
Average Home Value in this Area
Purchase History
| Date | Buyer | Sale Price | Title Company |
|---|---|---|---|
| Kutil Craig | $306,500 | Fidelity National Title Co | |
| Sheldon Gary M | -- | None Available | |
| Sheldon Gary M | $299,000 | -- | |
| Flynn Clay | -- | Financial Title Company | |
| Flynn Clay C | $205,000 | Financial Title Company | |
| Pinkard Thetius L | -- | Commonwealth Land Title |
Source: Public Records
Mortgage History
| Date | Status | Borrower | Loan Amount |
|---|---|---|---|
| Open | Kutil Craig | $245,000 | |
| Previous Owner | Flynn Clay C | $199,365 |
Source: Public Records
Tax History Compared to Growth
Tax History
| Year | Tax Paid | Tax Assessment Tax Assessment Total Assessment is a certain percentage of the fair market value that is determined by local assessors to be the total taxable value of land and additions on the property. | Land | Improvement |
|---|---|---|---|---|
| 2025 | $5,389 | $395,221 | $118,489 | $276,732 |
| 2024 | $5,389 | $387,474 | $116,166 | $271,308 |
| 2023 | $5,303 | $379,876 | $113,888 | $265,988 |
| 2022 | $5,221 | $372,430 | $111,656 | $260,774 |
| 2021 | $5,112 | $365,130 | $109,467 | $255,663 |
| 2020 | $4,938 | $361,389 | $108,346 | $253,043 |
| 2019 | $8,553 | $354,303 | $106,221 | $248,082 |
| 2018 | $8,445 | $347,358 | $104,139 | $243,219 |
| 2017 | $5,978 | $340,549 | $102,098 | $238,451 |
| 2016 | $4,445 | $333,873 | $100,096 | $233,777 |
| 2015 | $4,198 | $328,861 | $98,594 | $230,267 |
| 2014 | $4,138 | $322,421 | $96,663 | $225,758 |
Source: Public Records
Map
Nearby Homes
- 243 Northwood Commons
- 654 Daisyfield Dr
- 828 Olivina Ave Unit 11
- 693 Mayten Dr
- 678 Crane Ave
- 974 Ventura Ave
- 258 Turnstone Dr
- 727 Sandpiper Common
- 562 Swallow Dr
- 761 Pine St
- 635 Zermatt St
- 646 Brighton Way
- 457 Coleen St
- 1059 Lakehurst Rd
- 651 Brookfield Dr
- 127 Elvira St
- 1001 Murrieta Blvd Unit 4
- 1001 Murrieta Blvd Unit 114
- 173 Rainier Ave
- 1244 Locust St
- 291 Northwood Commons
- 293 Northwood Com
- 293 Northwood Commons
- 279 Northwood Commons
- 295 Northwood Commons
- 277 Northwood Commons
- 277 Northwood Commons
- 297 Northwood Commons
- 275 Northwood Common
- 275 Northwood Commons
- 275 Northwood Commons
- 273 Northwood Commons
- 249 Northwood Commons
- 249 Northwood Commons
- 373 Northwood Cm St
- 267 Northwood Commons
- 267 Northwood Commons
- 247 Northwood Commons
- 247 Northwood Commons
- 245 Northwood Commons