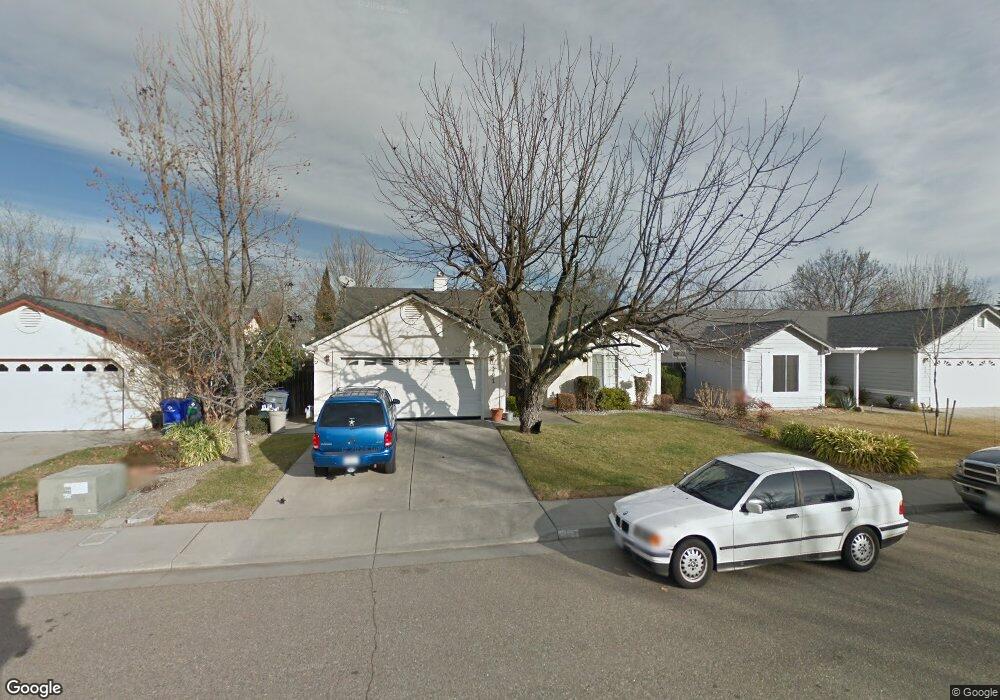
291 Pinon Way Red Bluff, CA 96080
Estimated Value: $319,000 - $433,000
3
Beds
2
Baths
1,614
Sq Ft
$232/Sq Ft
Est. Value
About This Home
This home is located at 291 Pinon Way, Red Bluff, CA 96080 and is currently estimated at $374,966, approximately $232 per square foot. 291 Pinon Way is a home located in Tehama County with nearby schools including Jackson Heights Elementary School, Vista Preparatory Academy, and Red Bluff High School.
Ownership History
Date
Name
Owned For
Owner Type
Purchase Details
Closed on
Nov 2, 2021
Sold by
Beaven Holly
Bought by
Davis Roxanne
Current Estimated Value
Home Financials for this Owner
Home Financials are based on the most recent Mortgage that was taken out on this home.
Original Mortgage
$338,259
Outstanding Balance
$309,129
Interest Rate
2.8%
Mortgage Type
FHA
Estimated Equity
$65,837
Purchase Details
Closed on
Aug 11, 2003
Sold by
Beaven Tony and Beaven Holly
Bought by
Beaven Holly
Home Financials for this Owner
Home Financials are based on the most recent Mortgage that was taken out on this home.
Original Mortgage
$141,000
Interest Rate
5.46%
Mortgage Type
Purchase Money Mortgage
Purchase Details
Closed on
Sep 21, 2001
Sold by
Bickert Fred
Bought by
Bickert Holly
Home Financials for this Owner
Home Financials are based on the most recent Mortgage that was taken out on this home.
Original Mortgage
$118,400
Interest Rate
6.91%
Create a Home Valuation Report for This Property
The Home Valuation Report is an in-depth analysis detailing your home's value as well as a comparison with similar homes in the area
Purchase History
| Date | Buyer | Sale Price | Title Company |
|---|---|---|---|
| Davis Roxanne | $344,500 | Timios Title A Ca Corp | |
| Beaven Holly | -- | Chicago Title Co | |
| Bickert Holly | -- | Chicago Title Co |
Source: Public Records
Mortgage History
| Date | Status | Borrower | Loan Amount |
|---|---|---|---|
| Open | Davis Roxanne | $338,259 | |
| Previous Owner | Beaven Holly | $141,000 | |
| Previous Owner | Bickert Holly | $118,400 |
Source: Public Records
Tax History
| Year | Tax Paid | Tax Assessment Tax Assessment Total Assessment is a certain percentage of the fair market value that is determined by local assessors to be the total taxable value of land and additions on the property. | Land | Improvement |
|---|---|---|---|---|
| 2025 | $3,744 | $368,769 | $68,978 | $299,791 |
| 2023 | $3,681 | $354,450 | $66,300 | $288,150 |
| 2022 | $3,625 | $344,500 | $65,000 | $279,500 |
| 2021 | $1,857 | $179,945 | $36,867 | $143,078 |
| 2020 | $1,896 | $178,100 | $36,489 | $141,611 |
| 2019 | $1,907 | $174,609 | $35,774 | $138,835 |
| 2018 | $1,764 | $171,186 | $35,073 | $136,113 |
| 2017 | $1,780 | $167,831 | $34,386 | $133,445 |
| 2016 | $1,662 | $164,541 | $33,712 | $130,829 |
| 2015 | $1,636 | $162,070 | $33,206 | $128,864 |
| 2014 | $1,613 | $158,896 | $32,556 | $126,340 |
Source: Public Records
Map
Nearby Homes
Your Personal Tour Guide
Ask me questions while you tour the home.