
Seller's Agent in 2025
Ann Halder
BHHS Professional Realty
(937) 266-3550
21 in this area
52 Total Sales
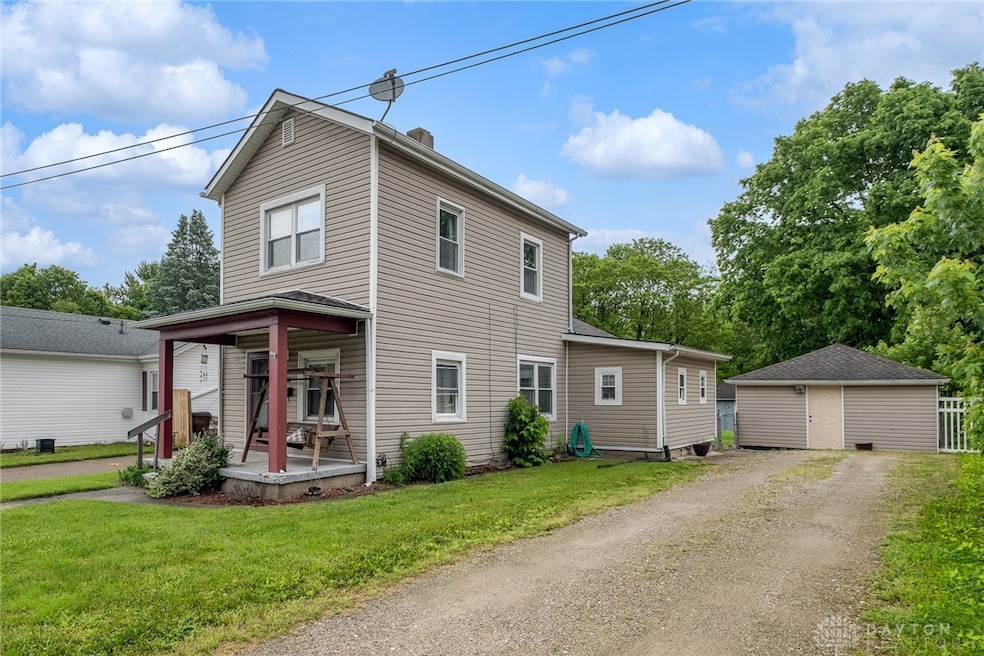
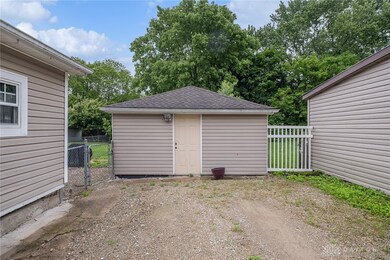
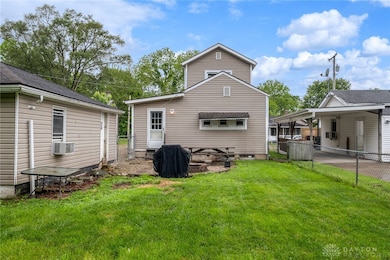
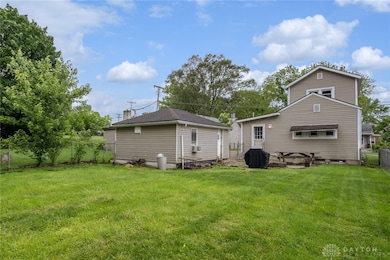
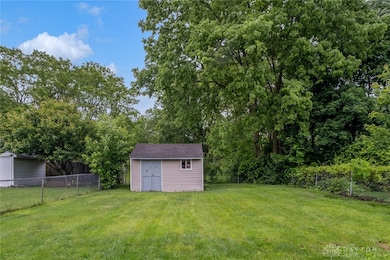
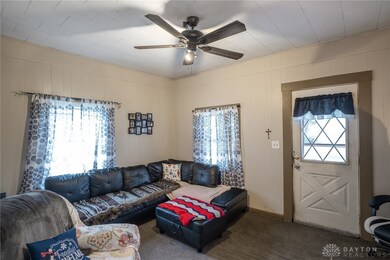
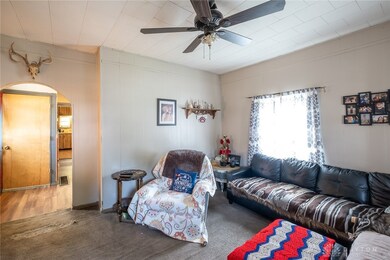
Fantastic location for this historic Xenia home (built: 1800)***walking trails to Xenia Bike Hub and, of course, the Xenia Bike Trail, and park areas and children's play yard, and vintage Caboose***beautiful rear fenced yard with no rear neighbors just park area***Also in rear yard is nice storage shed (14 x 12) AND large outbuilding (20 x 16) which was a 1 car garage until a former owner decided to make it a workroom - framing still there for garage door - would not be too difficult to convert back - With a window AC ***Roof & Vinyl siding - 2011; Furnace 2002***Kitchen is spacious - Pantry cabinet is attached to the wall - dishwasher portable, does work, but not being used by seller - lots of cabinet space in kitchen***Gas water heater, Sump pump; Washer 2019; Refrigerator 2020; Range 2015***Dryer present but not working***Replacement windows throughout***Walls throughout home tastefully painted - nice decor***New vinyl planking on first floor hallway, bathroom, entry***Schedule a showing to see this hidden gem.
Last Agent to Sell the Property
BHHS Professional Realty Brokerage Phone: (937) 426-7070 License #0000436641 Listed on: 05/23/2025
Co-Listed By
BHHS Professional Realty Brokerage Phone: (937) 426-7070 License #2022006601
| Date | Type | Sale Price | Title Company |
|---|---|---|---|
| Certificate Of Transfer | -- | -- | |
| Interfamily Deed Transfer | $40,000 | -- | |
| Land Contract | $40,350 | -- | |
| Warranty Deed | $39,000 | -- |
| Date | Status | Loan Amount | Loan Type |
|---|---|---|---|
| Previous Owner | $43,000 | No Value Available | |
| Previous Owner | $40,350 | Seller Take Back |
| Date | Event | Price | List to Sale | Price per Sq Ft |
|---|---|---|---|---|
| 07/31/2025 07/31/25 | Sold | $125,000 | -10.3% | $130 / Sq Ft |
| 06/30/2025 06/30/25 | Price Changed | $139,400 | -0.4% | $145 / Sq Ft |
| 05/23/2025 05/23/25 | For Sale | $139,900 | -- | $146 / Sq Ft |
| Year | Tax Paid | Tax Assessment Tax Assessment Total Assessment is a certain percentage of the fair market value that is determined by local assessors to be the total taxable value of land and additions on the property. | Land | Improvement |
|---|---|---|---|---|
| 2024 | $1,196 | $28,680 | $4,730 | $23,950 |
| 2023 | $1,196 | $28,680 | $4,730 | $23,950 |
| 2022 | $1,061 | $21,690 | $3,780 | $17,910 |
| 2021 | $1,075 | $21,690 | $3,780 | $17,910 |
| 2020 | $1,029 | $21,690 | $3,780 | $17,910 |
| 2019 | $809 | $16,050 | $3,850 | $12,200 |
| 2018 | $812 | $16,050 | $3,850 | $12,200 |
| 2017 | $788 | $16,050 | $3,850 | $12,200 |
| 2016 | $828 | $16,070 | $3,850 | $12,220 |
| 2015 | $831 | $16,070 | $3,850 | $12,220 |
| 2014 | $795 | $16,070 | $3,850 | $12,220 |
Seller's Agent in 2025
Ann Halder
BHHS Professional Realty
(937) 266-3550
21 in this area
52 Total Sales
Seller Co-Listing Agent in 2025
Heidi Menke
BHHS Professional Realty
(937) 266-3550
18 in this area
62 Total Sales
Buyer's Agent in 2025
Anthony Weese
Keller Williams Community Part
(937) 960-0661
21 in this area
66 Total Sales
Source: Dayton REALTORS®
MLS Number: 934727
APN: M40-0001-0009-0-0303-00
Disclaimer: Certain information contained herein is derived from information provided by parties other than Homes.com. All information provided is deemed reliable, but is not guaranteed to be accurate and should be independently verified.
![]() The information is being provided by Dayton Area Board of Realtors MLS. Information deemed reliable but not guaranteed. Information is provided for the consumer's personal, non-commercial use, and may not be used for any purpose other than the identification of potential properties for purchase. Copyright 2025 Dayton Area Board of Realtors MLS. All Rights Reserved.
The information is being provided by Dayton Area Board of Realtors MLS. Information deemed reliable but not guaranteed. Information is provided for the consumer's personal, non-commercial use, and may not be used for any purpose other than the identification of potential properties for purchase. Copyright 2025 Dayton Area Board of Realtors MLS. All Rights Reserved.