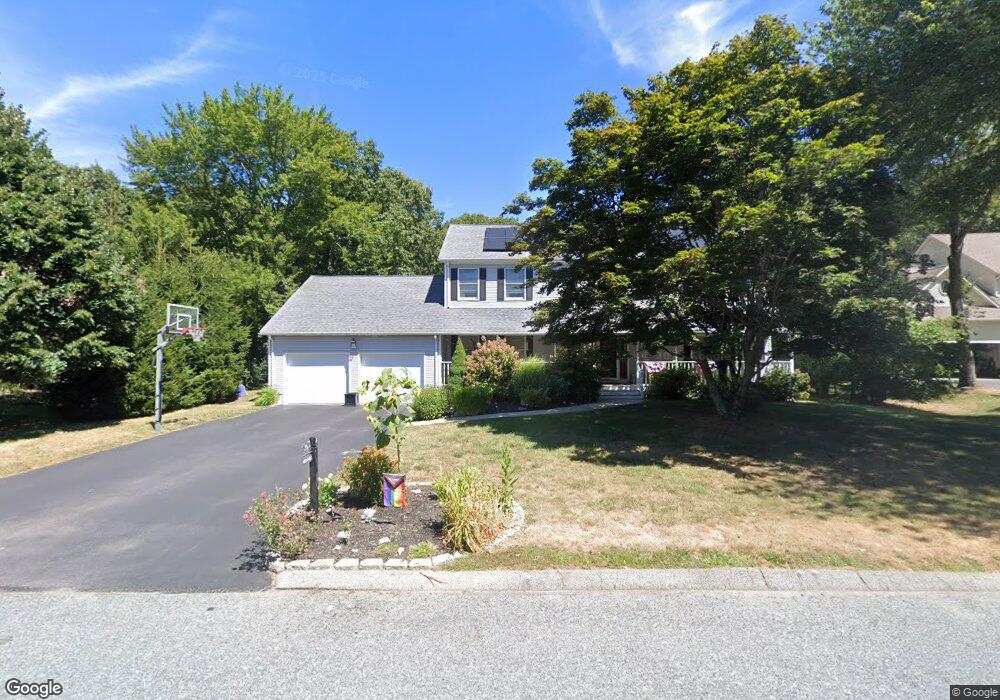
291 Table Rock Rd Wakefield, RI 02879
Estimated Value: $958,879 - $1,165,000
4
Beds
4
Baths
4,248
Sq Ft
$245/Sq Ft
Est. Value
About This Home
This home is located at 291 Table Rock Rd, Wakefield, RI 02879 and is currently estimated at $1,042,470, approximately $245 per square foot. 291 Table Rock Rd is a home located in Washington County with nearby schools including South Kingstown High School, Kingston Hill Academy, and The Compass School.
Ownership History
Date
Name
Owned For
Owner Type
Purchase Details
Closed on
Apr 5, 2024
Sold by
Monnes Alicia A
Bought by
Alicia M Monnes Lt
Current Estimated Value
Purchase Details
Closed on
Sep 16, 2011
Sold by
Reul Dawn M
Bought by
Monnes Robert H and Monnes Alicia A
Home Financials for this Owner
Home Financials are based on the most recent Mortgage that was taken out on this home.
Original Mortgage
$279,000
Interest Rate
4.38%
Mortgage Type
Purchase Money Mortgage
Purchase Details
Closed on
Jul 11, 1995
Sold by
Karnes Richard S and Karnes Janice
Bought by
Reul Dawn M and Reul Thomas
Purchase Details
Closed on
Sep 3, 1991
Sold by
Downing Indian Lake
Bought by
Karnes Richard
Create a Home Valuation Report for This Property
The Home Valuation Report is an in-depth analysis detailing your home's value as well as a comparison with similar homes in the area
Home Values in the Area
Average Home Value in this Area
Purchase History
| Date | Buyer | Sale Price | Title Company |
|---|---|---|---|
| Alicia M Monnes Lt | -- | None Available | |
| Monnes Robert H | $400,000 | -- | |
| Reul Dawn M | $248,500 | -- | |
| Karnes Richard | $55,000 | -- | |
| Karnes Richard | $55,000 | -- |
Source: Public Records
Mortgage History
| Date | Status | Borrower | Loan Amount |
|---|---|---|---|
| Previous Owner | Karnes Richard | $236,500 | |
| Previous Owner | Karnes Richard | $268,000 | |
| Previous Owner | Karnes Richard | $279,000 |
Source: Public Records
Tax History
| Year | Tax Paid | Tax Assessment Tax Assessment Total Assessment is a certain percentage of the fair market value that is determined by local assessors to be the total taxable value of land and additions on the property. | Land | Improvement |
|---|---|---|---|---|
| 2025 | $7,741 | $865,900 | $228,100 | $637,800 |
| 2024 | $7,922 | $716,900 | $209,100 | $507,800 |
| 2023 | $8,143 | $736,900 | $209,100 | $527,800 |
| 2022 | $8,069 | $736,900 | $209,100 | $527,800 |
| 2021 | $7,543 | $522,000 | $140,700 | $381,300 |
| 2020 | $7,543 | $522,000 | $140,700 | $381,300 |
| 2019 | $7,543 | $522,000 | $140,700 | $381,300 |
| 2018 | $7,747 | $494,100 | $152,400 | $341,700 |
| 2017 | $7,565 | $494,100 | $152,400 | $341,700 |
| 2016 | $7,447 | $493,500 | $152,400 | $341,100 |
| 2015 | $7,262 | $467,900 | $138,600 | $329,300 |
| 2014 | $7,243 | $467,900 | $138,600 | $329,300 |
Source: Public Records
Map
Nearby Homes
- 0 Indian Trail Trail S Unit 1389828
- 0 Indian Run Trail Unit 1403300
- 95 S Woods Dr
- 261 Saugatucket Rd
- 416 Bridgetown Rd
- 9 Edwards Ave
- 125 Montauk Rd
- 5 Wayland Trail
- 78 Conservatory Way Unit 78
- 54 Isabelle Dr
- 604 Stony Fort Rd
- 106 S Bay Dr
- 36 Sachem Rd
- 12 Park Ave Unit 13
- 106 Pettaquamscutt Lake Rd
- 15 Jessica Ln
- 30 Crest Ave
- 1029 Boston Neck Rd Unit 2
- 57 Rocky Brook Way
- 51 Bonnet Shores Rd
- 301 Table Rock Rd
- 281 Table Rock Rd
- 311 Table Rock Rd
- 271 Table Rock Rd
- 288 Table Rock Rd
- 300 Table Rock Rd
- 278 Table Rock Rd
- 263 Table Rock Rd
- 262 Table Rock Rd
- 253 Table Rock Rd
- 238 Table Rock Rd
- 243 Table Rock Rd
- 31 White Falls Trail
- 41 White Falls Trail
- 21 White Falls Trail
- 232 Table Rock Rd
- 235 Table Rock Rd
- 11 White Falls Trail
- 57 White Falls Trail
- 223 Table Rock Rd
Your Personal Tour Guide
Ask me questions while you tour the home.