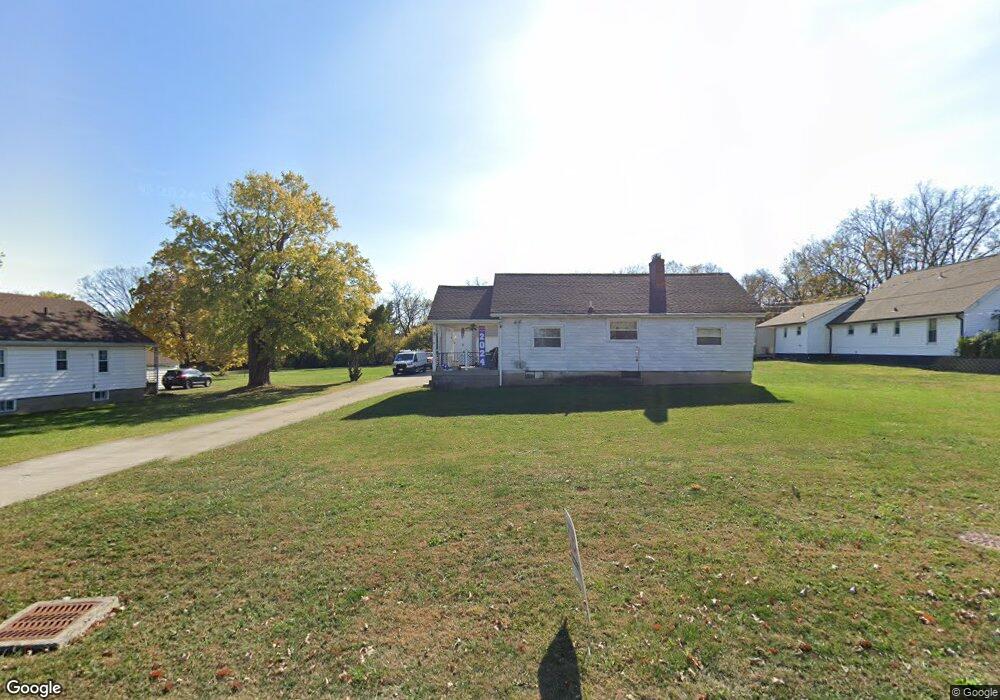
291 W Kemper Rd Cincinnati, OH 45246
Estimated Value: $218,000 - $228,650
3
Beds
3
Baths
1,356
Sq Ft
$166/Sq Ft
Est. Value
About This Home
This home is located at 291 W Kemper Rd, Cincinnati, OH 45246 and is currently estimated at $225,163, approximately $166 per square foot. 291 W Kemper Rd is a home located in Hamilton County with nearby schools including Springdale Elementary School, Princeton Community Middle School, and Princeton High School.
Ownership History
Date
Name
Owned For
Owner Type
Purchase Details
Closed on
Sep 19, 2012
Sold by
Grieshop James B
Bought by
Grieshop Tina R
Current Estimated Value
Purchase Details
Closed on
May 30, 2001
Sold by
Kinsley Dennis R
Bought by
Grieshop James B
Purchase Details
Closed on
May 15, 2001
Sold by
Gieshop James B
Bought by
Kinsley Dennis R
Purchase Details
Closed on
Mar 15, 1996
Sold by
Grieshop Hope A
Bought by
Grieshop James B
Purchase Details
Closed on
Dec 28, 1994
Sold by
Brandenburg Minnie Phillips
Bought by
Grieshop James B
Home Financials for this Owner
Home Financials are based on the most recent Mortgage that was taken out on this home.
Original Mortgage
$70,300
Interest Rate
9.24%
Create a Home Valuation Report for This Property
The Home Valuation Report is an in-depth analysis detailing your home's value as well as a comparison with similar homes in the area
Home Values in the Area
Average Home Value in this Area
Purchase History
| Date | Buyer | Sale Price | Title Company |
|---|---|---|---|
| Grieshop Tina R | -- | None Available | |
| Grieshop James B | -- | Superior Title Agency Inc | |
| Kinsley Dennis R | -- | Superior Title Agency Inc | |
| Grieshop James B | -- | -- | |
| Grieshop James B | -- | -- |
Source: Public Records
Mortgage History
| Date | Status | Borrower | Loan Amount |
|---|---|---|---|
| Previous Owner | Grieshop James B | $70,300 |
Source: Public Records
Tax History
| Year | Tax Paid | Tax Assessment Tax Assessment Total Assessment is a certain percentage of the fair market value that is determined by local assessors to be the total taxable value of land and additions on the property. | Land | Improvement |
|---|---|---|---|---|
| 2025 | $2,903 | $56,407 | $14,536 | $41,871 |
| 2024 | $2,577 | $56,407 | $14,536 | $41,871 |
| 2023 | $2,531 | $56,407 | $14,536 | $41,871 |
| 2022 | $2,639 | $47,951 | $14,172 | $33,779 |
| 2021 | $2,621 | $47,951 | $14,172 | $33,779 |
| 2020 | $2,585 | $47,951 | $14,172 | $33,779 |
| 2019 | $2,403 | $40,986 | $12,114 | $28,872 |
| 2018 | $2,266 | $40,986 | $12,114 | $28,872 |
| 2017 | $2,162 | $40,986 | $12,114 | $28,872 |
| 2016 | $1,905 | $35,421 | $11,491 | $23,930 |
| 2015 | $1,895 | $35,421 | $11,491 | $23,930 |
| 2014 | $1,897 | $35,421 | $11,491 | $23,930 |
| 2013 | $1,974 | $37,682 | $12,226 | $25,456 |
Source: Public Records
Map
Nearby Homes
- 256 Centerbury Ct Unit 67
- 287 Bedford Glen Ln Unit 27
- 237 Eastwick Dr
- 290 Nelson Ln
- 11570 Rose Ln
- 10 Woodside Ct
- 163 Washington Ave
- 22 Oakwood Ct
- 604 Smiley Ave
- 440 W Sharon Rd
- 958 Summit Ave
- 694 Park Ave
- 45 S Lake Ave
- 483 Vista Glen Dr
- 516 Salzberg Ln
- 11481 Fremantle Dr
- 612 Brightview Place Unit 30
- 614 Brightview Place Unit 29
- 626 Brightview Place Unit 24
- 622 Brightview Place Unit 26
- 299 W Kemper Rd
- 283 W Kemper Rd
- 275 W Kemper Rd
- 305 W Kemper Rd
- 294 W Kemper Rd
- 288 W Kemper Rd
- 302 W Kemper Rd
- 282 W Kemper Rd
- 269 W Kemper Rd
- 310 W Kemper Rd
- 309 W Kemper Rd
- 272 W Kemper Rd
- 311 W Kemper Rd
- 263 W Kemper Rd
- 266 W Kemper Rd
- 292 Centerbury Ct
- 290 Centerbury Ct Unit 47
- 288 Centerbury Ct
- 294 Bedford Glen Ln
- 257 W Kemper Rd
Your Personal Tour Guide
Ask me questions while you tour the home.