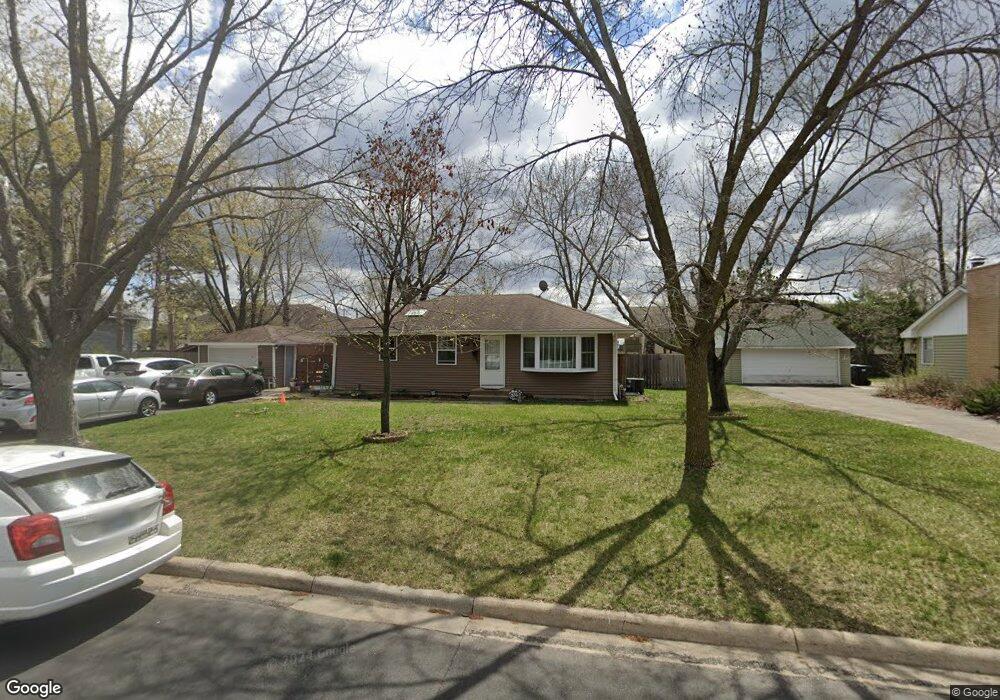
2910 113th Ln NW Coon Rapids, MN 55433
Estimated Value: $332,000 - $360,341
5
Beds
2
Baths
1,040
Sq Ft
$337/Sq Ft
Est. Value
About This Home
This home is located at 2910 113th Ln NW, Coon Rapids, MN 55433 and is currently estimated at $350,585, approximately $337 per square foot. 2910 113th Ln NW is a home located in Anoka County with nearby schools including Lucile Bruner Elementary School, Hoover Elementary School, and Laughlin Junior/Senior High School.
Ownership History
Date
Name
Owned For
Owner Type
Purchase Details
Closed on
Jul 28, 2017
Sold by
Esler Matthew
Bought by
Arcangel Ginalyn and Arcangel Charllyn
Current Estimated Value
Home Financials for this Owner
Home Financials are based on the most recent Mortgage that was taken out on this home.
Original Mortgage
$219,942
Outstanding Balance
$49,005
Interest Rate
3.88%
Mortgage Type
Stand Alone First
Estimated Equity
$301,580
Purchase Details
Closed on
May 15, 2015
Sold by
Hsbc Bank Usa National Association
Bought by
Esler Matthew
Home Financials for this Owner
Home Financials are based on the most recent Mortgage that was taken out on this home.
Original Mortgage
$144,000
Interest Rate
3.82%
Mortgage Type
New Conventional
Purchase Details
Closed on
Apr 25, 2014
Sold by
Hunt Kellen and Hunt Suzanne
Bought by
Hsbc Bank Usa National Association
Purchase Details
Closed on
Dec 26, 1996
Sold by
Tufte Jamie L and Dahl Tufte Amy M
Bought by
Hunt Kellen
Create a Home Valuation Report for This Property
The Home Valuation Report is an in-depth analysis detailing your home's value as well as a comparison with similar homes in the area
Home Values in the Area
Average Home Value in this Area
Purchase History
| Date | Buyer | Sale Price | Title Company |
|---|---|---|---|
| Arcangel Ginalyn | $224,000 | Dca Title | |
| Esler Matthew | $160,000 | Change Of Title Inc | |
| Hsbc Bank Usa National Association | $221,237 | None Available | |
| Hunt Kellen | $89,900 | -- |
Source: Public Records
Mortgage History
| Date | Status | Borrower | Loan Amount |
|---|---|---|---|
| Open | Arcangel Ginalyn | $219,942 | |
| Closed | Arcangel Ginalyn | $219,942 | |
| Previous Owner | Esler Matthew | $144,000 |
Source: Public Records
Tax History Compared to Growth
Tax History
| Year | Tax Paid | Tax Assessment Tax Assessment Total Assessment is a certain percentage of the fair market value that is determined by local assessors to be the total taxable value of land and additions on the property. | Land | Improvement |
|---|---|---|---|---|
| 2025 | $3,424 | $337,100 | $90,000 | $247,100 |
| 2024 | $3,424 | $328,900 | $87,000 | $241,900 |
| 2023 | $2,858 | $309,400 | $67,000 | $242,400 |
| 2022 | $2,652 | $295,600 | $67,000 | $228,600 |
| 2021 | $2,522 | $246,700 | $65,000 | $181,700 |
| 2020 | $2,566 | $230,600 | $59,000 | $171,600 |
| 2019 | $2,380 | $225,200 | $61,000 | $164,200 |
| 2018 | $2,108 | $204,900 | $0 | $0 |
| 2017 | $1,817 | $179,200 | $0 | $0 |
| 2016 | $1,591 | $137,300 | $0 | $0 |
| 2015 | -- | $137,300 | $46,000 | $91,300 |
| 2014 | -- | $117,300 | $36,300 | $81,000 |
Source: Public Records
Map
Nearby Homes
- 2851 113th Ave NW
- 2862 116th Ave NW
- 3020 117th Ave NW
- 2728 109th Ln NW
- 11749 Crooked Lake Blvd NW
- 2965 108th Ln NW
- 11835 Crocus St NW
- 3501 115th Ln NW
- 3074 121st Ave NW
- 2400 108th Ave NW
- 12019 Zion St NW
- 11000 Swallow St NW
- 11409 Quinn St NW
- 11681 Tulip St NW
- 10648 Wren St NW
- 10616 Arrowhead St NW
- 11984 Orchid St NW
- 12189 Lily St NW
- 11476 W River Rd
- 11424 Hanson Blvd NW
- 2860 113th Ln NW
- 2920 113th Ln NW
- 2875 113th Ave NW
- 2871 113th Ave NW
- 2911 113th Ln NW
- 2865 113th Ave NW
- 2850 113th Ln NW
- 2930 113th Ln NW
- 2861 113th Ave NW
- 2857 113th Ln NW
- 2849 113th Ln NW
- 2910 114th Ave NW
- 2840 113th Ln NW
- 11351 Gladiola St NW
- 2940 113th Ln NW
- 2900 114th Ave NW
- 11330 Gladiola St NW
- 11340 Gladiola St NW
- 2841 113th Ln NW
- 2860 114th Ave NW