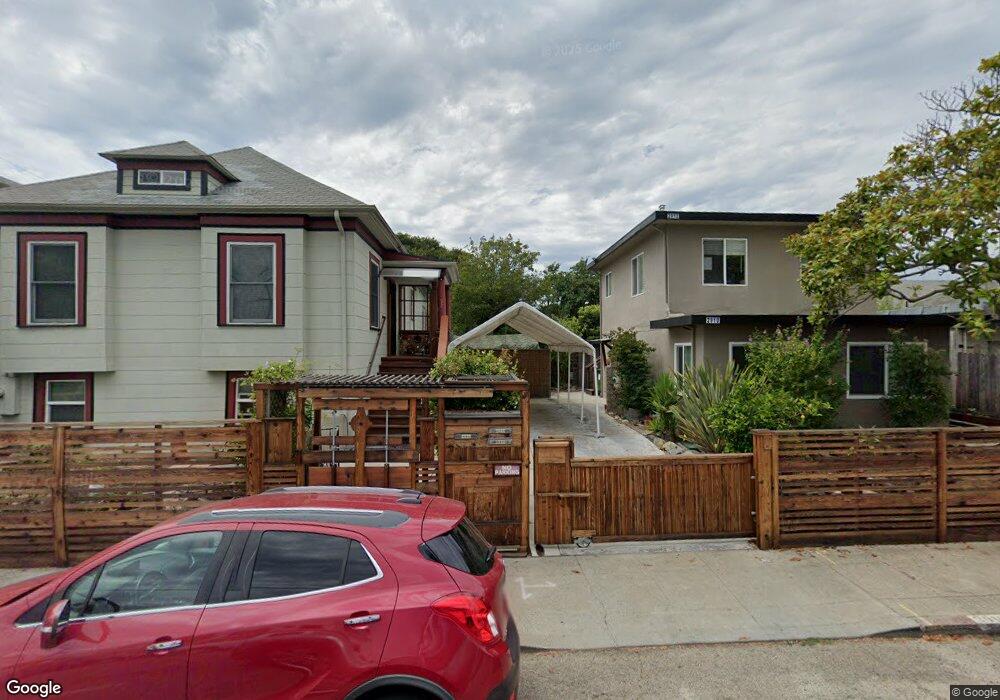
2910 California St Berkeley, CA 94703
South Berkeley NeighborhoodEstimated Value: $1,174,000 - $1,509,000
5
Beds
3
Baths
2,064
Sq Ft
$633/Sq Ft
Est. Value
About This Home
This home is located at 2910 California St, Berkeley, CA 94703 and is currently estimated at $1,307,333, approximately $633 per square foot. 2910 California St is a home located in Alameda County with nearby schools including Malcolm X Elementary School, Washington Elementary School, and Oxford Elementary School.
Ownership History
Date
Name
Owned For
Owner Type
Purchase Details
Closed on
Mar 21, 2025
Sold by
Payne Lazondas
Bought by
Lazondas Payne Trust and Payne
Current Estimated Value
Purchase Details
Closed on
Sep 3, 2013
Sold by
Coaxum Ava and Payne Lazondas
Bought by
Payne Lazondas and Coaxum Ava
Home Financials for this Owner
Home Financials are based on the most recent Mortgage that was taken out on this home.
Original Mortgage
$150,000
Interest Rate
4.36%
Mortgage Type
New Conventional
Purchase Details
Closed on
Oct 28, 1999
Sold by
Holland Holland Joyce C Joyce C and Holland Joyce
Bought by
Bryant Joyce Holland and Joyce Holland Bryant Revocable
Create a Home Valuation Report for This Property
The Home Valuation Report is an in-depth analysis detailing your home's value as well as a comparison with similar homes in the area
Home Values in the Area
Average Home Value in this Area
Purchase History
| Date | Buyer | Sale Price | Title Company |
|---|---|---|---|
| Lazondas Payne Trust | -- | None Listed On Document | |
| Payne Lazondas | -- | Fidelity National Title Co | |
| Coaxum Ava | -- | Fidelity National Title Co | |
| Bryant Joyce Holland | -- | -- |
Source: Public Records
Mortgage History
| Date | Status | Borrower | Loan Amount |
|---|---|---|---|
| Previous Owner | Coaxum Ava | $150,000 |
Source: Public Records
Tax History
| Year | Tax Paid | Tax Assessment Tax Assessment Total Assessment is a certain percentage of the fair market value that is determined by local assessors to be the total taxable value of land and additions on the property. | Land | Improvement |
|---|---|---|---|---|
| 2025 | $4,733 | $72,081 | $37,757 | $34,324 |
| 2024 | $4,733 | $70,668 | $37,017 | $33,651 |
| 2023 | $4,597 | $69,282 | $36,291 | $32,991 |
| 2022 | $4,430 | $67,925 | $35,580 | $32,345 |
| 2021 | $4,380 | $66,592 | $34,882 | $31,710 |
| 2020 | $3,946 | $65,909 | $34,524 | $31,385 |
| 2019 | $3,569 | $64,617 | $33,847 | $30,770 |
| 2018 | $3,460 | $63,351 | $33,184 | $30,167 |
| 2017 | $3,296 | $62,108 | $32,533 | $29,575 |
| 2016 | $3,040 | $60,891 | $31,895 | $28,996 |
| 2015 | $2,979 | $59,976 | $31,416 | $28,560 |
| 2014 | $3,080 | $58,802 | $30,801 | $28,001 |
Source: Public Records
Map
Nearby Homes
- 1535 Julia St
- 1646 Ashby Ave
- 2926 Ellis St
- 2922 Stanton St
- 1507 Prince St
- 2790 Sacramento St
- 3114 California St
- 3101 Sacramento St
- 2782 Sacramento St
- 2774 Sacramento St
- 2758 Sacramento St
- 2750 Sacramento St
- 1450 Ward St
- 3138 California St
- 1515 Derby St
- 1612 Carleton St
- 1314 Ashby Ave
- 2701 Grant St
- 3214 California St
- 1612 Parker St
- 1543 Julia St
- 2930 California St
- 1539 Julia St
- 2900 California St
- 1542 Russell St
- 1538 Russell St
- 1601 Julia St
- 2911 California St Unit Upper
- 2911 California St
- 1534 Russell St
- 1605 Julia St
- 1533 Julia St
- 1550 Julia St
- 1530 Russell St
- 1527 Julia St
- 2951 California St
- 2956 California St
- 1526 Russell St
- 1540 Julia St
- 1525 Julia St
Your Personal Tour Guide
Ask me questions while you tour the home.