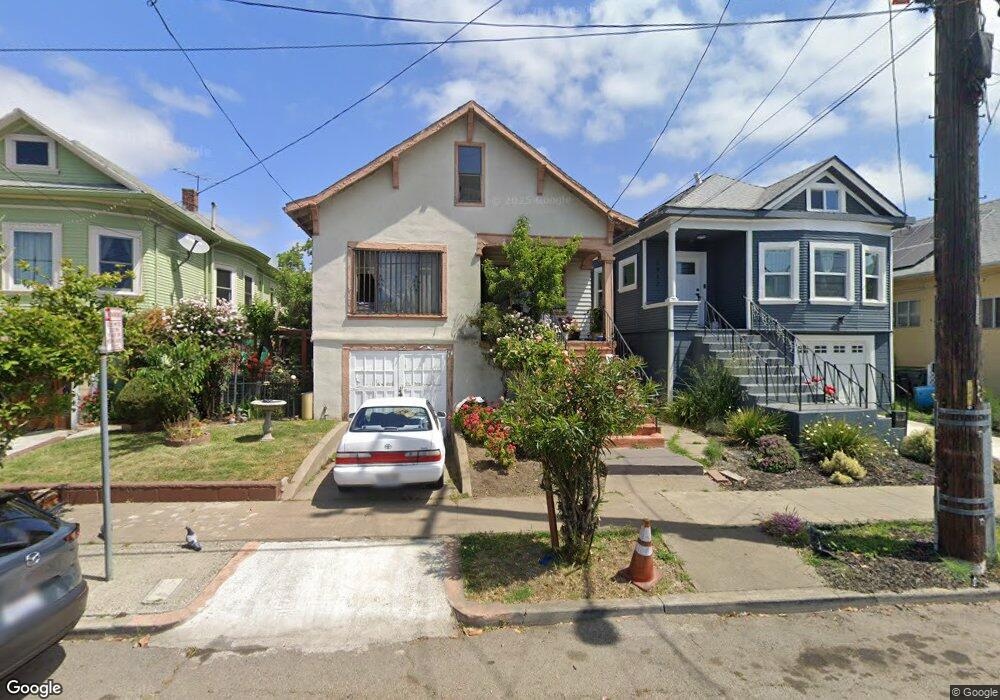
2910 E 22nd St Oakland, CA 94601
Sausal Creek NeighborhoodEstimated Value: $479,989 - $597,000
2
Beds
1
Bath
857
Sq Ft
$645/Sq Ft
Est. Value
About This Home
This home is located at 2910 E 22nd St, Oakland, CA 94601 and is currently estimated at $552,997, approximately $645 per square foot. 2910 E 22nd St is a home located in Alameda County with nearby schools including Manzanita Community School, Manzanita Seed Elementary School, and Urban Promise Academy.
Ownership History
Date
Name
Owned For
Owner Type
Purchase Details
Closed on
Jul 6, 2024
Sold by
Giouzelis Margarita
Bought by
Giouzelis Ron
Current Estimated Value
Purchase Details
Closed on
May 30, 2009
Sold by
Barrameda Evaluz
Bought by
Giouzelis Margarita
Purchase Details
Closed on
May 21, 2004
Sold by
Giouzelis Anastasios P
Bought by
Giouzelis Peter
Purchase Details
Closed on
Nov 27, 2001
Sold by
Polychroniou Giuzelis Anastasios P and Polychroniou Giuzelis Anastasios
Bought by
Revocab Giouzelis Anastasios P and Revocab Anastasios P Giouzelis
Create a Home Valuation Report for This Property
The Home Valuation Report is an in-depth analysis detailing your home's value as well as a comparison with similar homes in the area
Home Values in the Area
Average Home Value in this Area
Purchase History
| Date | Buyer | Sale Price | Title Company |
|---|---|---|---|
| Giouzelis Ron | -- | None Listed On Document | |
| Giouzelis Margarita | -- | None Available | |
| Giouzelis Peter | -- | -- | |
| Giouzelis Anastasios P | -- | -- | |
| Revocab Giouzelis Anastasios P | -- | -- |
Source: Public Records
Tax History
| Year | Tax Paid | Tax Assessment Tax Assessment Total Assessment is a certain percentage of the fair market value that is determined by local assessors to be the total taxable value of land and additions on the property. | Land | Improvement |
|---|---|---|---|---|
| 2025 | $3,915 | $333,637 | $99,892 | $233,745 |
| 2024 | $3,915 | $163,995 | $48,808 | $115,187 |
| 2023 | $4,004 | $160,779 | $47,851 | $112,928 |
| 2022 | $3,838 | $157,627 | $46,913 | $110,714 |
| 2021 | $3,539 | $154,537 | $45,993 | $108,544 |
| 2020 | $3,499 | $152,952 | $45,521 | $107,431 |
| 2019 | $3,286 | $149,954 | $44,629 | $105,325 |
| 2018 | $3,221 | $147,014 | $43,754 | $103,260 |
| 2017 | $3,068 | $144,131 | $42,896 | $101,235 |
| 2016 | $2,889 | $141,305 | $42,055 | $99,250 |
| 2015 | $2,870 | $139,184 | $41,424 | $97,760 |
| 2014 | $2,807 | $136,458 | $40,612 | $95,846 |
Source: Public Records
Map
Nearby Homes
- 2912 E 22nd St
- 2918 Foothill Blvd
- 2724 E 22nd St
- 3243 E 23rd St
- 3020 E 19th St
- 2021 Mitchell St
- 2004 27th Ave
- 2017 27th Ave
- 1832 Fruitvale Ave
- 2618 E 20th St
- 3038 E 18th St
- 2510 E 21st St
- 2628 Logan St
- 1742 28th Ave
- 2409 25th Ave
- 1945 26th Ave
- 3311 E 17th St
- 3256 Prentiss St
- 2547 E 27th St
- 2222 Inyo Ave
Your Personal Tour Guide
Ask me questions while you tour the home.