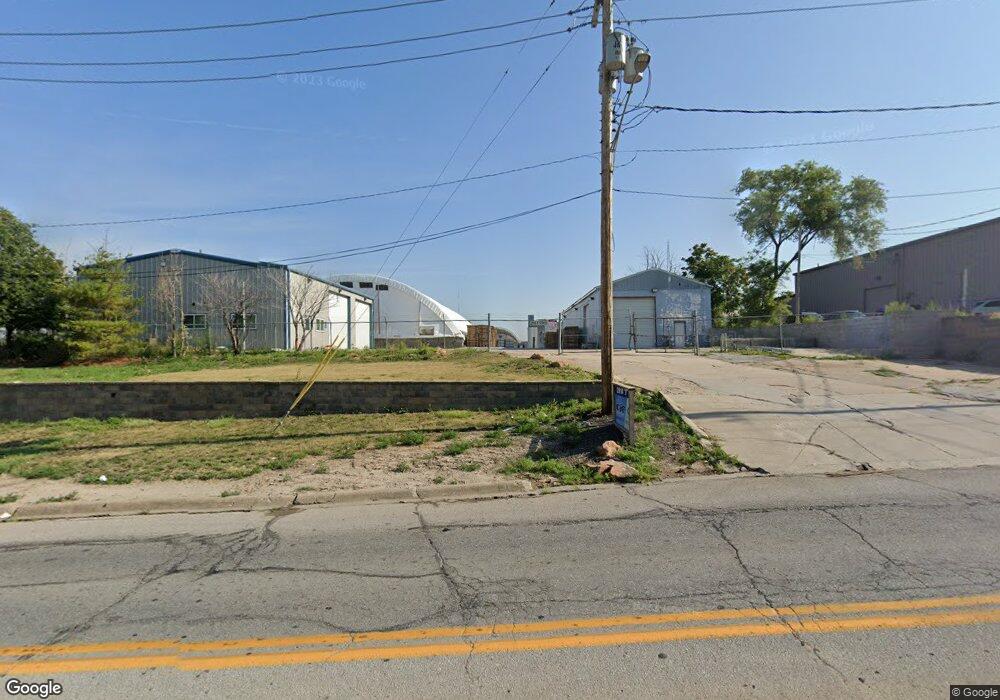
2910 F St Omaha, NE 68107
South Central Omaha Neighborhood
--
Bed
--
Bath
300
Sq Ft
2.7
Acres
About This Home
This home is located at 2910 F St, Omaha, NE 68107. 2910 F St is a home located in Douglas County with nearby schools including Spring Lake Magnet Center, R.M. Marrs Magnet Middle School, and South High School.
Ownership History
Date
Name
Owned For
Owner Type
Purchase Details
Closed on
Dec 6, 2010
Sold by
Corporate Lawn Care Inc
Bought by
Gangestad Properties Llc
Home Financials for this Owner
Home Financials are based on the most recent Mortgage that was taken out on this home.
Original Mortgage
$256,375
Outstanding Balance
$169,554
Interest Rate
4.24%
Mortgage Type
Future Advance Clause Open End Mortgage
Purchase Details
Closed on
Oct 12, 2010
Sold by
Ponfinio General Incorporated
Bought by
Corporate Lawn Care Inc
Home Financials for this Owner
Home Financials are based on the most recent Mortgage that was taken out on this home.
Original Mortgage
$256,375
Outstanding Balance
$169,554
Interest Rate
4.24%
Mortgage Type
Future Advance Clause Open End Mortgage
Purchase Details
Closed on
Jul 13, 2007
Sold by
L & S Camper Repair & Storage Inc
Bought by
Ponfinio General Inc
Create a Home Valuation Report for This Property
The Home Valuation Report is an in-depth analysis detailing your home's value as well as a comparison with similar homes in the area
Home Values in the Area
Average Home Value in this Area
Purchase History
| Date | Buyer | Sale Price | Title Company |
|---|---|---|---|
| Gangestad Properties Llc | -- | None Available | |
| Corporate Lawn Care Inc | $310,000 | None Available | |
| Ponfinio General Inc | $275,000 | -- |
Source: Public Records
Mortgage History
| Date | Status | Borrower | Loan Amount |
|---|---|---|---|
| Open | Gangestad Properties Llc | $256,375 |
Source: Public Records
Tax History Compared to Growth
Tax History
| Year | Tax Paid | Tax Assessment Tax Assessment Total Assessment is a certain percentage of the fair market value that is determined by local assessors to be the total taxable value of land and additions on the property. | Land | Improvement |
|---|---|---|---|---|
| 2024 | $9,446 | $463,200 | $299,700 | $163,500 |
| 2023 | $9,446 | $447,700 | $215,000 | $232,700 |
| 2022 | $9,228 | $432,300 | $215,000 | $217,300 |
| 2021 | $6,949 | $328,300 | $215,000 | $113,300 |
| 2020 | $7,029 | $328,300 | $215,000 | $113,300 |
| 2019 | $6,654 | $309,900 | $215,000 | $94,900 |
| 2018 | $6,663 | $309,900 | $215,000 | $94,900 |
| 2017 | $6,253 | $289,400 | $215,000 | $74,400 |
| 2016 | $6,210 | $289,400 | $215,000 | $74,400 |
| 2015 | $5,744 | $271,300 | $215,000 | $56,300 |
| 2014 | $5,744 | $271,300 | $215,000 | $56,300 |
Source: Public Records
Map
Nearby Homes