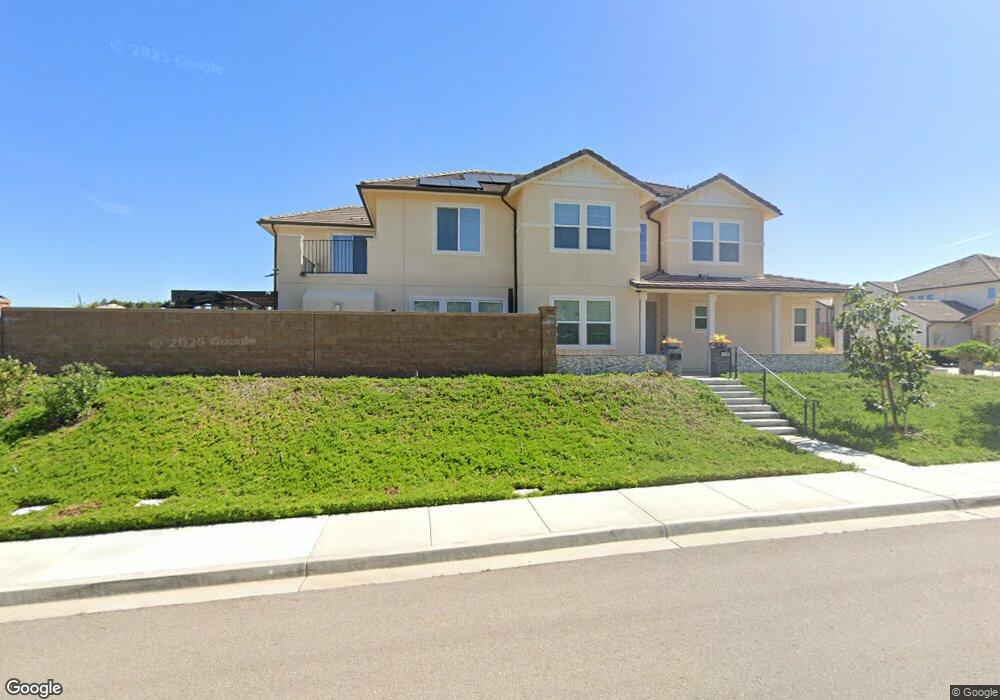
2910 Hayloft Place Escondido, CA 92029
Estimated Value: $1,343,621 - $1,558,000
4
Beds
4
Baths
3,242
Sq Ft
$449/Sq Ft
Est. Value
About This Home
This home is located at 2910 Hayloft Place, Escondido, CA 92029 and is currently estimated at $1,457,155, approximately $449 per square foot. 2910 Hayloft Place is a home with nearby schools including Bernardo Elementary School, Del Dios Academy of Arts & Sciences, and San Pasqual High School.
Ownership History
Date
Name
Owned For
Owner Type
Purchase Details
Closed on
Sep 16, 2019
Sold by
Sunstreet Energy Group Llc
Bought by
Ho James and Ho Thuy Thi
Current Estimated Value
Home Financials for this Owner
Home Financials are based on the most recent Mortgage that was taken out on this home.
Original Mortgage
$620,000
Outstanding Balance
$543,072
Interest Rate
3.6%
Mortgage Type
New Conventional
Estimated Equity
$914,083
Purchase Details
Closed on
Sep 10, 2019
Sold by
Calatlantic Group Inc
Bought by
Ho James Ban and Ho Thuy Thi
Home Financials for this Owner
Home Financials are based on the most recent Mortgage that was taken out on this home.
Original Mortgage
$620,000
Outstanding Balance
$543,072
Interest Rate
3.6%
Mortgage Type
New Conventional
Estimated Equity
$914,083
Purchase Details
Closed on
Jun 19, 2019
Sold by
Phan Quyen
Bought by
Ho Thuy Thi
Create a Home Valuation Report for This Property
The Home Valuation Report is an in-depth analysis detailing your home's value as well as a comparison with similar homes in the area
Home Values in the Area
Average Home Value in this Area
Purchase History
| Date | Buyer | Sale Price | Title Company |
|---|---|---|---|
| Ho James | -- | Calatlantic Title | |
| Ho James Ban | $802,000 | Calatlantic Title Company | |
| Ho Thuy Thi | -- | Calatlantic Title |
Source: Public Records
Mortgage History
| Date | Status | Borrower | Loan Amount |
|---|---|---|---|
| Open | Ho James Ban | $620,000 |
Source: Public Records
Tax History Compared to Growth
Tax History
| Year | Tax Paid | Tax Assessment Tax Assessment Total Assessment is a certain percentage of the fair market value that is determined by local assessors to be the total taxable value of land and additions on the property. | Land | Improvement |
|---|---|---|---|---|
| 2025 | $15,676 | $876,666 | $174,981 | $701,685 |
| 2024 | $15,676 | $859,477 | $171,550 | $687,927 |
| 2023 | $15,311 | $842,626 | $168,187 | $674,439 |
| 2022 | $15,033 | $826,105 | $164,890 | $661,215 |
| 2021 | $14,744 | $809,907 | $161,657 | $648,250 |
| 2020 | $14,866 | $801,603 | $160,000 | $641,603 |
| 2019 | $7,554 | $116,732 | $116,732 | $0 |
| 2018 | $1,380 | $114,444 | $114,444 | $0 |
| 2017 | $1,356 | $112,200 | $112,200 | $0 |
| 2016 | $1,328 | $110,000 | $110,000 | $0 |
| 2015 | $539 | $39,269 | $39,269 | $0 |
Source: Public Records
Map
Nearby Homes
- 2880 Livery Place
- 21678 Long Trot Dr
- 21644 Long Trot Dr
- 3012 Starry Night Dr
- 3035 Starry Night Dr
- 3068 Mimlus Place
- 21622 Saddle Bred Ln
- 21578 Saddle Bred Ln
- 21639 Trail Blazer Ln
- 21505 Trail Blazer Ln
- 21547 Trail Blazer Ln
- 22058 Purebred Ln
- 21408 Trail Ridge Dr
- 2831 Fishers Place
- 0 Country Club Dr Unit 250019307
- 0 Kauana Loa Dr Unit 15 250034201
- 0 Kauana Loa Dr Unit 17 250034204
- 0 Kauana Loa Dr Unit 16 250034203
- 0 Kauana Loa Dr Unit 18 250034208
- 0 Coronado Hills Dr Unit 37
- 2914 Hayloft Place
- 2918 Hayloft Place
- 2938 Hayloft Place
- 2922 Hayloft Place
- 2934 Hayloft Place
- 2926 Hayloft Place
- 2930 Hayloft Place
- 21964 Gallop Way
- 21976 Gallop Way
- 21952 Gallop Way
- 22029 Gallop Way
- 2991 Hayloft Place
- 2950 Hayloft Place
- 21988 Gallop Way
- 2958 Hayloft Place
- 22006 Gallop Way
- 2850 Livery Place
- 22018 Gallop Way
- 21946 Gallop Way
- 2962 Hayloft Place