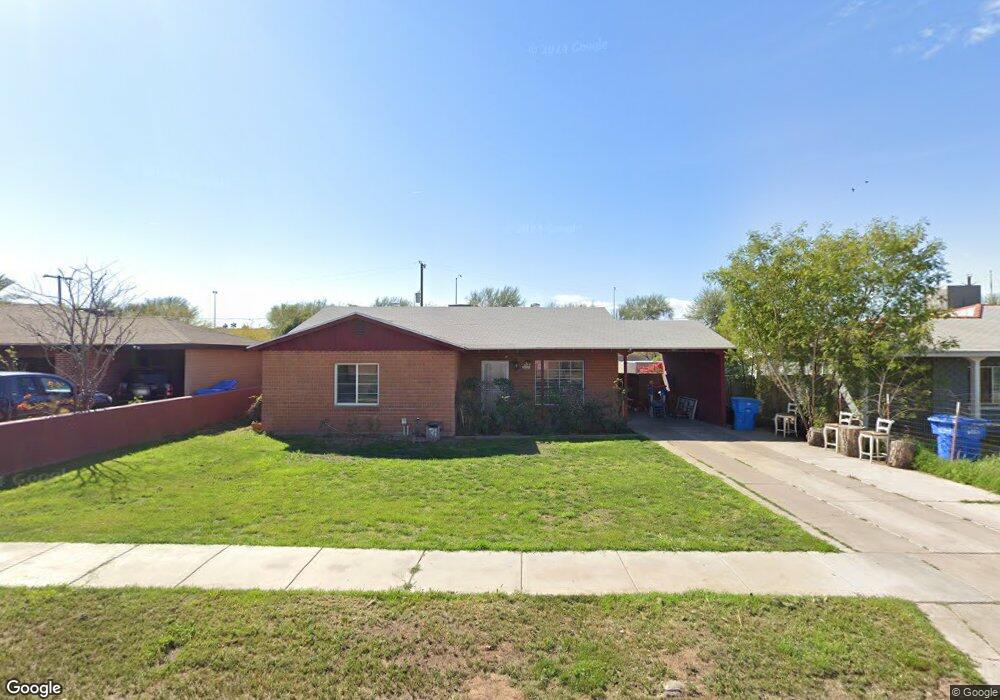
2911 E Culver St Phoenix, AZ 85008
Central City NeighborhoodEstimated Value: $261,000 - $417,000
Studio
1
Bath
1,244
Sq Ft
$274/Sq Ft
Est. Value
About This Home
This home is located at 2911 E Culver St, Phoenix, AZ 85008 and is currently estimated at $341,446, approximately $274 per square foot. 2911 E Culver St is a home located in Maricopa County with nearby schools including The Creighton Academy, Camelback High School, and Phoenix Coding Academy.
Ownership History
Date
Name
Owned For
Owner Type
Purchase Details
Closed on
Nov 21, 2019
Sold by
Valencia Adalberto
Bought by
Valencia Adalberto and Cabralez Vanessa
Current Estimated Value
Home Financials for this Owner
Home Financials are based on the most recent Mortgage that was taken out on this home.
Original Mortgage
$141,470
Outstanding Balance
$95,049
Interest Rate
3.5%
Mortgage Type
VA
Estimated Equity
$246,397
Purchase Details
Closed on
May 30, 2015
Sold by
Ellexson Gary and Seeley Rhonda Jo
Bought by
Valencia Adalberto
Home Financials for this Owner
Home Financials are based on the most recent Mortgage that was taken out on this home.
Original Mortgage
$102,000
Interest Rate
3.81%
Mortgage Type
VA
Purchase Details
Closed on
Aug 4, 1999
Sold by
Ellexson William Lee and Ellexson Vera Alline
Bought by
Ellexson William L and Ellexson Vera A
Create a Home Valuation Report for This Property
The Home Valuation Report is an in-depth analysis detailing your home's value as well as a comparison with similar homes in the area
Home Values in the Area
Average Home Value in this Area
Purchase History
| Date | Buyer | Sale Price | Title Company |
|---|---|---|---|
| Valencia Adalberto | -- | Fidelity National Ttl Of Or | |
| Valencia Adalberto | $102,000 | Chicago Title Agency Inc | |
| Ellexson William L | -- | -- |
Source: Public Records
Mortgage History
| Date | Status | Borrower | Loan Amount |
|---|---|---|---|
| Open | Valencia Adalberto | $141,470 | |
| Closed | Valencia Adalberto | $102,000 |
Source: Public Records
Tax History
| Year | Tax Paid | Tax Assessment Tax Assessment Total Assessment is a certain percentage of the fair market value that is determined by local assessors to be the total taxable value of land and additions on the property. | Land | Improvement |
|---|---|---|---|---|
| 2025 | $624 | $5,225 | -- | -- |
| 2024 | $593 | $4,976 | -- | -- |
| 2023 | $593 | $21,270 | $4,250 | $17,020 |
| 2022 | $568 | $16,730 | $3,340 | $13,390 |
| 2021 | $589 | $14,730 | $2,940 | $11,790 |
| 2020 | $574 | $13,860 | $2,770 | $11,090 |
| 2019 | $570 | $11,230 | $2,240 | $8,990 |
| 2018 | $558 | $10,080 | $2,010 | $8,070 |
| 2017 | $535 | $7,810 | $1,560 | $6,250 |
| 2016 | $513 | $6,950 | $1,390 | $5,560 |
| 2015 | $479 | $5,310 | $1,060 | $4,250 |
Source: Public Records
Map
Nearby Homes
- 2646 E Willetta St
- 1713 N 31st Place
- 1618 N 32nd St Unit 6
- 1618 N 32nd St Unit 2
- 2621 E Brill St
- 2950 E Granada Rd
- 1002 N 27th Place
- 1714 N 32nd St
- 2708 E Roosevelt St
- 1808 N 32nd St Unit 209
- 1008 N 27th St
- 1915 N 31st St
- 2021 N 29th St
- 1121 N 25th Place
- 1113 N 25th Place
- 1812 N 32nd Place
- 2201 N 29th Place
- 2444 E Willetta St Unit 1
- 3321 E Belleview St
- 2046 N 27th Place
- 2915 E Culver St
- 2907 E Culver St
- 2921 E Culver St
- 2901 E Culver St
- 2925 E Culver St
- 2912 E Culver St
- 2916 E Culver St
- 2908 E Culver St
- 2922 E Culver St
- 2902 E Culver St
- 2929 E Culver St
- 2926 E Culver St
- 1216 N 29th St
- 1222 N 29th St
- 1212 N 29th St
- 1226 N 29th St
- 2930 E Culver St
- 2935 E Culver St
- 2841 E Culver St
- 2911 E Willetta St
Your Personal Tour Guide
Ask me questions while you tour the home.