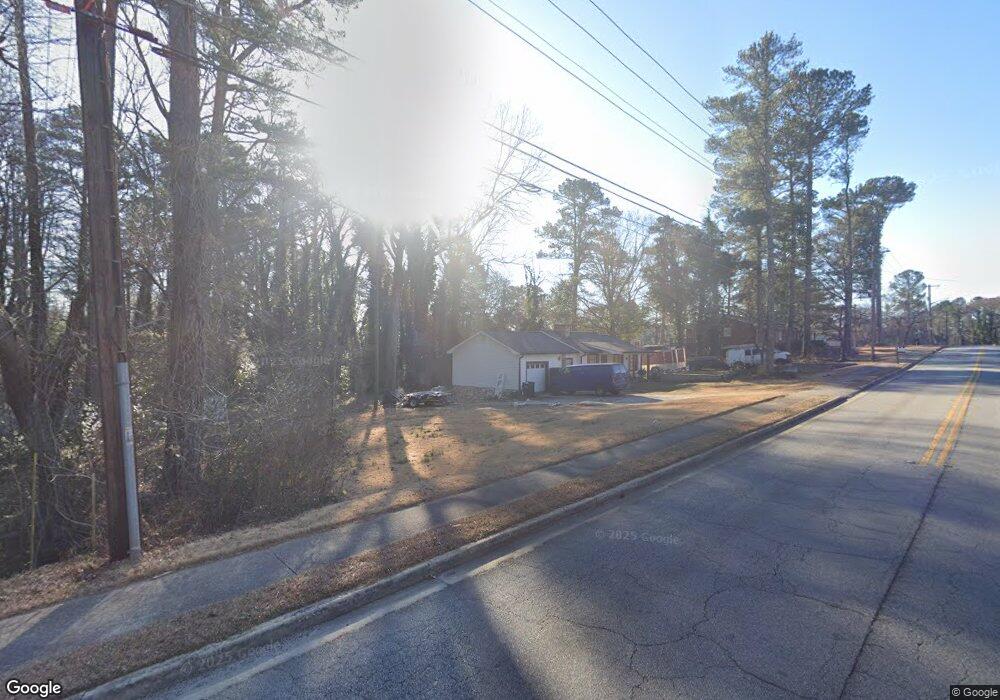
2911 Favor Rd SW Marietta, GA 30060
Southwestern Marietta NeighborhoodEstimated Value: $321,000 - $365,163
3
Beds
2
Baths
1,150
Sq Ft
$294/Sq Ft
Est. Value
About This Home
This home is located at 2911 Favor Rd SW, Marietta, GA 30060 and is currently estimated at $338,291, approximately $294 per square foot. 2911 Favor Rd SW is a home located in Cobb County with nearby schools including Birney Elementary School, Floyd Middle School, and Osborne High School.
Ownership History
Date
Name
Owned For
Owner Type
Purchase Details
Closed on
Dec 4, 2020
Sold by
Metro Capital Properties Llc
Bought by
Murillo Silvia
Current Estimated Value
Home Financials for this Owner
Home Financials are based on the most recent Mortgage that was taken out on this home.
Original Mortgage
$171,000
Outstanding Balance
$151,890
Interest Rate
2.7%
Mortgage Type
New Conventional
Estimated Equity
$186,401
Purchase Details
Closed on
Jul 23, 2020
Sold by
Falcon Mutual Llc
Bought by
Metro Capital Properties Llc
Purchase Details
Closed on
Aug 23, 2002
Sold by
James Charles E
Bought by
Jones Christopher R
Home Financials for this Owner
Home Financials are based on the most recent Mortgage that was taken out on this home.
Original Mortgage
$120,051
Interest Rate
6.21%
Mortgage Type
FHA
Create a Home Valuation Report for This Property
The Home Valuation Report is an in-depth analysis detailing your home's value as well as a comparison with similar homes in the area
Home Values in the Area
Average Home Value in this Area
Purchase History
| Date | Buyer | Sale Price | Title Company |
|---|---|---|---|
| Murillo Silvia | $228,000 | Ntc Key West | |
| Metro Capital Properties Llc | $123,000 | None Available | |
| Falcon Mutual Llc | $113,100 | None Available | |
| Collier Justin | $95,000 | None Available | |
| Jones Christopher R | $121,000 | -- |
Source: Public Records
Mortgage History
| Date | Status | Borrower | Loan Amount |
|---|---|---|---|
| Open | Murillo Silvia | $171,000 | |
| Previous Owner | Jones Christopher R | $120,051 |
Source: Public Records
Tax History Compared to Growth
Tax History
| Year | Tax Paid | Tax Assessment Tax Assessment Total Assessment is a certain percentage of the fair market value that is determined by local assessors to be the total taxable value of land and additions on the property. | Land | Improvement |
|---|---|---|---|---|
| 2025 | $3,917 | $130,000 | $120,000 | $10,000 |
| 2024 | $4,538 | $150,508 | $120,000 | $30,508 |
| 2023 | $4,099 | $135,968 | $108,000 | $27,968 |
| 2022 | $3,277 | $107,968 | $80,000 | $27,968 |
| 2021 | $2,768 | $91,200 | $70,880 | $20,320 |
| 2020 | $2,083 | $68,640 | $48,000 | $20,640 |
| 2019 | $2,083 | $68,640 | $48,000 | $20,640 |
| 2018 | $1,411 | $46,484 | $28,000 | $18,484 |
| 2017 | $1,336 | $46,484 | $28,000 | $18,484 |
| 2016 | $1,195 | $41,560 | $24,000 | $17,560 |
| 2015 | $1,322 | $44,876 | $28,000 | $16,876 |
| 2014 | $1,333 | $44,876 | $0 | $0 |
Source: Public Records
Map
Nearby Homes
- 2969 Favor Rd SW Unit 1
- 537 Shay Dr SW Unit 9
- 444 White Oak Dr SW
- 430 Church Rd SW
- 3065 Moser Way
- 3090 Moser Way
- 3241 Wildwood Dr SW
- 2604 Favor Rd SW
- 825 Winfield Ct SW
- 800 Grindstone Place SW
- 641 Favorwood Dr SW
- 2760 Hicks Rd SW
- 3308 Wildwood Dr SW
- 959 Old Milford Church Rd SW
- 3421 Mill Stream Ln SW Unit 3
- 2940 Caller Ct SW
- 2780 Northwood Ct SW
- 187 Timber Creek Ln SW
- 588 White Oak Dr SW
- 2910 Favor Rd SW
- 2936 Favor Rd SW
- 574 White Oak Dr SW
- 2906 Favor Rd SW
- 2938 Favor Rd SW
- 562 White Oak Dr SW
- 2881 Favor Rd SW
- 2894 Favor Rd SW
- 2940 Favor Rd SW
- 575 White Oak Dr SW
- 2921 Neese Dr SW
- 548 White Oak Dr SW
- 563 White Oak Dr SW
- 0 Neese Dr Unit 3215631
- 0 Neese Dr
- 2920 White Oak Terrace SW
- 2935 Neese Dr SW
- 2960 Favor Rd SW
- 2930 White Oak Terrace SW