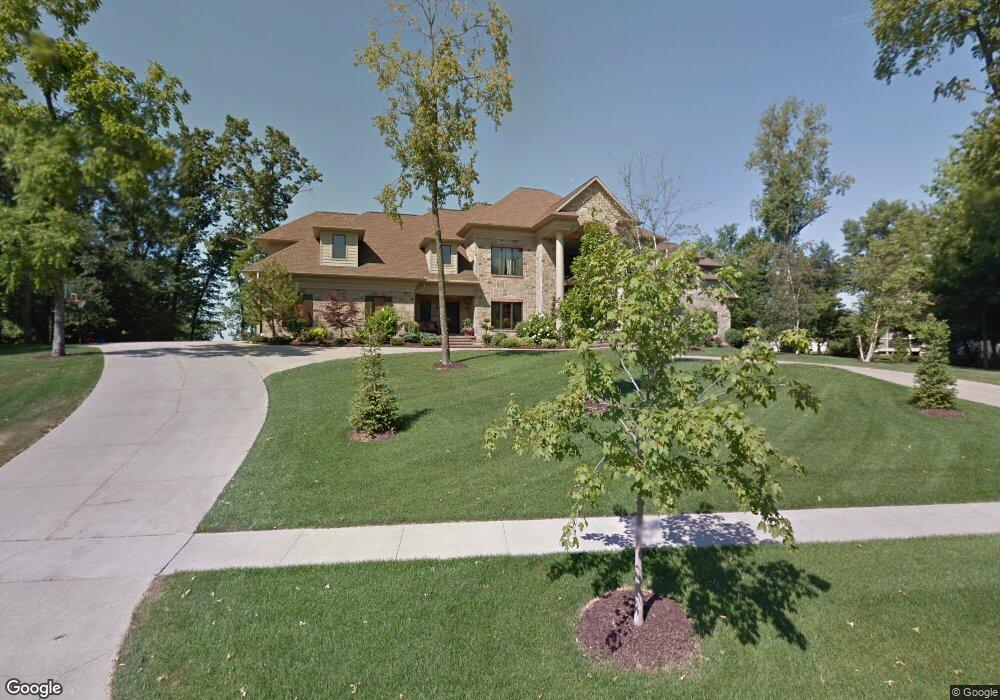
2911 Long Bluff Rd NE Cedar Rapids, IA 52402
Estimated Value: $694,000 - $1,342,944
5
Beds
6
Baths
5,974
Sq Ft
$158/Sq Ft
Est. Value
About This Home
This home is located at 2911 Long Bluff Rd NE, Cedar Rapids, IA 52402 and is currently estimated at $942,981, approximately $157 per square foot. 2911 Long Bluff Rd NE is a home located in Linn County with nearby schools including Ponderosa Elementary School, Pierce Elementary School, and Franklin Middle School.
Ownership History
Date
Name
Owned For
Owner Type
Purchase Details
Closed on
Jun 20, 2006
Sold by
Miner Mark E and Miner Elizabeth A
Bought by
Rexroth Jason A and Rexroth Teri M
Current Estimated Value
Purchase Details
Closed on
May 5, 2000
Sold by
Primahne Associates
Bought by
David Timothy R and Mann Tara L
Home Financials for this Owner
Home Financials are based on the most recent Mortgage that was taken out on this home.
Original Mortgage
$120,000
Interest Rate
8.26%
Create a Home Valuation Report for This Property
The Home Valuation Report is an in-depth analysis detailing your home's value as well as a comparison with similar homes in the area
Home Values in the Area
Average Home Value in this Area
Purchase History
| Date | Buyer | Sale Price | Title Company |
|---|---|---|---|
| Rexroth Jason A | $194,500 | None Available | |
| David Timothy R | $159,500 | -- |
Source: Public Records
Mortgage History
| Date | Status | Borrower | Loan Amount |
|---|---|---|---|
| Previous Owner | David Timothy R | $120,000 |
Source: Public Records
Tax History Compared to Growth
Tax History
| Year | Tax Paid | Tax Assessment Tax Assessment Total Assessment is a certain percentage of the fair market value that is determined by local assessors to be the total taxable value of land and additions on the property. | Land | Improvement |
|---|---|---|---|---|
| 2025 | $24,066 | $1,538,500 | $161,400 | $1,377,100 |
| 2024 | $26,828 | $1,370,400 | $161,400 | $1,209,000 |
| 2023 | $26,828 | $1,370,400 | $161,400 | $1,209,000 |
| 2022 | $25,344 | $1,280,800 | $161,400 | $1,119,400 |
| 2021 | $28,396 | $1,232,400 | $154,100 | $1,078,300 |
| 2020 | $28,396 | $1,295,600 | $154,100 | $1,141,500 |
| 2019 | $23,834 | $1,114,300 | $154,100 | $960,200 |
| 2018 | $23,172 | $1,114,300 | $154,100 | $960,200 |
| 2017 | $24,322 | $1,125,400 | $154,100 | $971,300 |
| 2016 | $24,633 | $1,158,900 | $154,100 | $1,004,800 |
| 2015 | $23,755 | $1,116,395 | $154,100 | $962,295 |
| 2014 | $23,570 | $1,116,395 | $154,100 | $962,295 |
| 2013 | $23,060 | $1,116,395 | $154,100 | $962,295 |
Source: Public Records
Map
Nearby Homes
- 122 Lakota Ct NE
- 2817 Old Orchard Rd NE
- 310 McKinsie Ct NE
- 3920 Wyndham Dr NE
- 3130 Adirondack Dr NE
- 3100 Blue Ridge Ct NE
- 4010 Red Cedar Dr NE Unit B
- 2218 Tranquil Ct NW
- 3604 Heatheridge Dr NE
- 3607 Foxborough Terrace NE Unit A
- 1585 Matterhorn Dr NE
- 3915 Lexington Dr NE Unit B
- 3524 Swallow Ct NE
- 3608 Foxborough Terrace NE Unit B
- 2445 Glass Rd NE
- 4113 Lexington Ct NE Unit C
- 4113 Lexington Ct NE Unit A
- 1759 Applewood Place NE
- 4131 Blue Jay Dr NE Unit A
- 4131 Blue Jay Dr NE Unit C
- 2800 Old Orchard Ct NE
- 128 Lakota Ct NE
- 2718 Old Orchard Ct NE
- 2904 Long Bluff Rd NE
- 2920 Long Bluff Rd NE
- 2710 Old Orchard Ct NE
- 2807 Old Orchard Rd NE
- 2818 Long Bluff Rd NE
- 2801 Old Orchard Ct NE
- 116 Lakota Ct NE
- 2809 Old Orchard Rd NE
- 123 Lakota Ct NE
- 21 Lakota Ct NE
- 2719 Old Orchard Ct NE
- 2908 Old Orchard Rd NE
- 2810 Long Bluff Rd NE
- 117 Lakota Ct NE
- 108 Lakota Ct NE
- 2817 Seneca Ct NE
- 2916 Old Orchard Rd NE