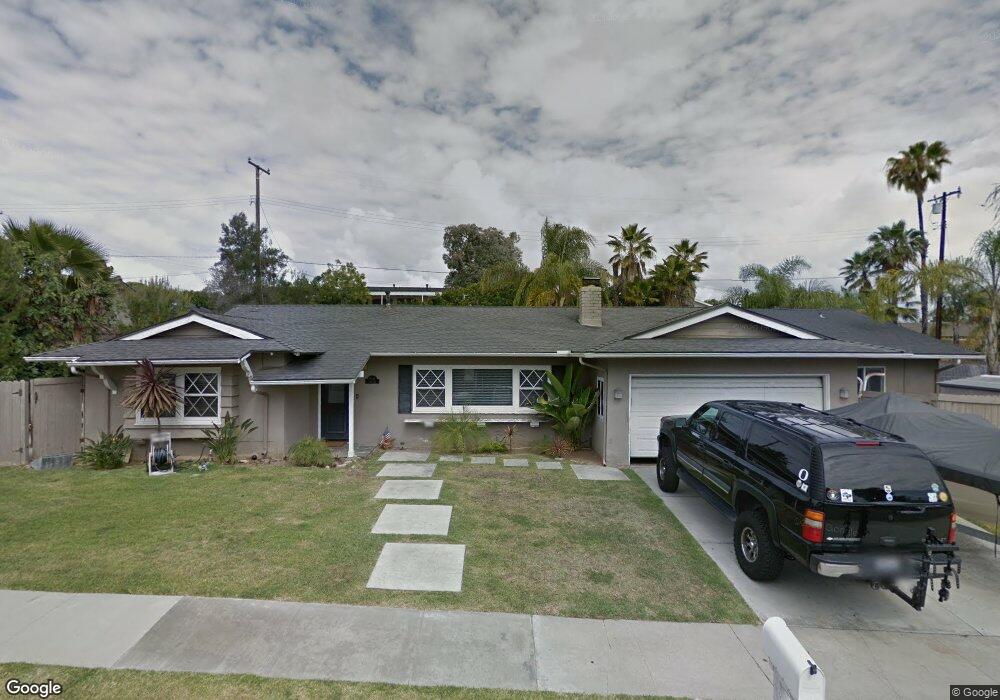
2911 Paper Ln Newport Beach, CA 92660
Bayview NeighborhoodEstimated Value: $1,877,000 - $2,641,000
4
Beds
4
Baths
2,026
Sq Ft
$1,112/Sq Ft
Est. Value
About This Home
This home is located at 2911 Paper Ln, Newport Beach, CA 92660 and is currently estimated at $2,252,801, approximately $1,111 per square foot. 2911 Paper Ln is a home located in Orange County with nearby schools including Mariners Elementary School, Horace Ensign Intermediate School, and Newport Harbor High School.
Ownership History
Date
Name
Owned For
Owner Type
Purchase Details
Closed on
Feb 2, 2004
Sold by
Synder Kent G and Snyder Amy K
Bought by
Mcphie Kenneth Melvin and Mcphie Gretchen Michelle
Current Estimated Value
Home Financials for this Owner
Home Financials are based on the most recent Mortgage that was taken out on this home.
Original Mortgage
$650,000
Outstanding Balance
$316,227
Interest Rate
6.37%
Mortgage Type
Purchase Money Mortgage
Estimated Equity
$1,936,574
Purchase Details
Closed on
Jan 3, 2003
Sold by
Snyder Kent Giles and Snyder Amy Knode
Bought by
Snyder Kent G and Snyder Amy K
Home Financials for this Owner
Home Financials are based on the most recent Mortgage that was taken out on this home.
Original Mortgage
$430,000
Interest Rate
5.12%
Purchase Details
Closed on
Jun 14, 1999
Sold by
Jeans Victoria
Bought by
Snyder Kent Giles and Snyder Amy Knode
Home Financials for this Owner
Home Financials are based on the most recent Mortgage that was taken out on this home.
Original Mortgage
$266,400
Interest Rate
7.25%
Create a Home Valuation Report for This Property
The Home Valuation Report is an in-depth analysis detailing your home's value as well as a comparison with similar homes in the area
Home Values in the Area
Average Home Value in this Area
Purchase History
| Date | Buyer | Sale Price | Title Company |
|---|---|---|---|
| Mcphie Kenneth Melvin | $850,000 | Equity Title | |
| Snyder Kent G | -- | American Title Co | |
| Snyder Kent Giles | -- | American Title Co | |
| Snyder Kent Giles | $333,000 | Chicago Title Co |
Source: Public Records
Mortgage History
| Date | Status | Borrower | Loan Amount |
|---|---|---|---|
| Open | Mcphie Kenneth Melvin | $650,000 | |
| Previous Owner | Snyder Kent Giles | $430,000 | |
| Previous Owner | Snyder Kent Giles | $266,400 | |
| Closed | Mcphie Kenneth Melvin | $199,900 |
Source: Public Records
Tax History Compared to Growth
Tax History
| Year | Tax Paid | Tax Assessment Tax Assessment Total Assessment is a certain percentage of the fair market value that is determined by local assessors to be the total taxable value of land and additions on the property. | Land | Improvement |
|---|---|---|---|---|
| 2025 | $12,903 | $1,208,517 | $1,056,443 | $152,074 |
| 2024 | $12,903 | $1,184,821 | $1,035,728 | $149,093 |
| 2023 | $12,685 | $1,161,590 | $1,015,420 | $146,170 |
| 2022 | $12,454 | $1,138,814 | $995,510 | $143,304 |
| 2021 | $12,128 | $1,116,485 | $975,990 | $140,495 |
| 2020 | $12,012 | $1,105,037 | $965,982 | $139,055 |
| 2019 | $11,767 | $1,083,370 | $947,041 | $136,329 |
| 2018 | $11,535 | $1,062,128 | $928,472 | $133,656 |
| 2017 | $11,332 | $1,041,302 | $910,266 | $131,036 |
| 2016 | $11,078 | $1,020,885 | $892,418 | $128,467 |
| 2015 | $10,933 | $1,002,000 | $888,487 | $113,513 |
| 2014 | $8,652 | $790,000 | $676,487 | $113,513 |
Source: Public Records
Map
Nearby Homes
- 2215 Golden Cir
- 2207 Golden Cir
- 333 Mesa Dr
- 300 Cutter Way
- 20462 Santa Ana Ave Unit D
- 281 Santo Tomas Ave
- 267 Mesa Dr
- 2512 Santa Ana Ave Unit 3
- 1546 August Ln Unit 7
- 20431 SW Cypress St
- 20391 SW Cypress St
- 20142 Kline Dr
- 228 Del Mar Ave
- 20301 SW Cypress St
- 20382 SW Cypress St
- 1572 Indus St
- 1632 Indus St
- 2321 Mesa Dr
- 2173 Orchard Dr
- 20304 SW Cypress St
- 2919 Paper Ln
- 2834 Irvine Ave
- 2842 Irvine Ave
- 2910 Paper Ln
- 20017 Golden Cir
- 2901 Paper Ln
- 2904 Paper Ln
- 2826 Irvine Ave
- 2900 Irvine Ave
- 2918 Paper Ln
- 2927 Paper Ln
- 2900 Paper Ln
- 2909 Silver Ln
- 2917 Silver Ln
- 2499 Anniversary Ln
- 2514 University Dr
- 2905 Silver Ln
- 2908 Irvine Ave
- 2512 University Dr
- 2518 University Dr