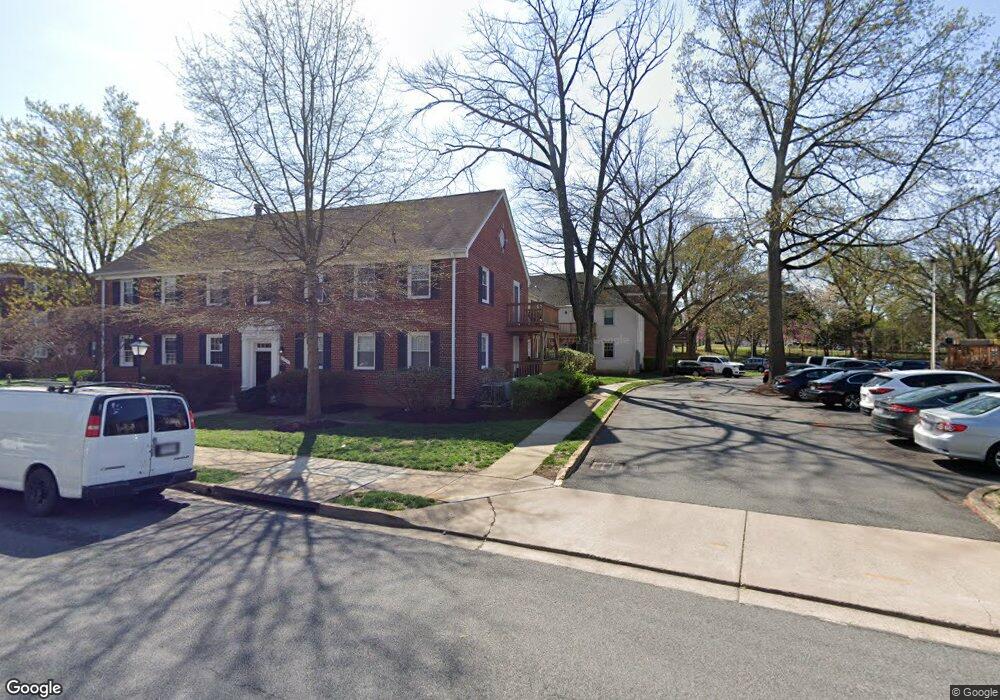
2912 13th Rd S Unit 12204 Arlington, VA 22204
Arlington Village NeighborhoodEstimated Value: $299,979 - $345,000
1
Bed
1
Bath
716
Sq Ft
$450/Sq Ft
Est. Value
About This Home
This home is located at 2912 13th Rd S Unit 12204, Arlington, VA 22204 and is currently estimated at $322,495, approximately $450 per square foot. 2912 13th Rd S Unit 12204 is a home located in Arlington County with nearby schools including Dr. Charles R. Drew Elementary, Thomas Jefferson Middle School, and Wakefield High School.
Ownership History
Date
Name
Owned For
Owner Type
Purchase Details
Closed on
Mar 27, 2015
Sold by
Purkat Marlene and Lynd Lacey
Bought by
Rivas George
Current Estimated Value
Home Financials for this Owner
Home Financials are based on the most recent Mortgage that was taken out on this home.
Original Mortgage
$266,611
Outstanding Balance
$204,793
Interest Rate
3.68%
Mortgage Type
VA
Estimated Equity
$117,702
Purchase Details
Closed on
May 22, 2006
Sold by
Wolven Marie
Bought by
Purkat Lacey
Home Financials for this Owner
Home Financials are based on the most recent Mortgage that was taken out on this home.
Original Mortgage
$125,000
Interest Rate
6.53%
Mortgage Type
New Conventional
Purchase Details
Closed on
Feb 14, 1997
Sold by
Sec Housing & Urban Affairs
Bought by
Barbour Marie C
Home Financials for this Owner
Home Financials are based on the most recent Mortgage that was taken out on this home.
Original Mortgage
$52,556
Interest Rate
7.6%
Mortgage Type
FHA
Create a Home Valuation Report for This Property
The Home Valuation Report is an in-depth analysis detailing your home's value as well as a comparison with similar homes in the area
Home Values in the Area
Average Home Value in this Area
Purchase History
| Date | Buyer | Sale Price | Title Company |
|---|---|---|---|
| Rivas George | $261,000 | -- | |
| Purkat Lacey | $250,000 | -- | |
| Barbour Marie C | $52,650 | -- |
Source: Public Records
Mortgage History
| Date | Status | Borrower | Loan Amount |
|---|---|---|---|
| Open | Rivas George | $266,611 | |
| Previous Owner | Purkat Lacey | $125,000 | |
| Previous Owner | Barbour Marie C | $52,556 |
Source: Public Records
Tax History Compared to Growth
Tax History
| Year | Tax Paid | Tax Assessment Tax Assessment Total Assessment is a certain percentage of the fair market value that is determined by local assessors to be the total taxable value of land and additions on the property. | Land | Improvement |
|---|---|---|---|---|
| 2025 | $2,921 | $282,800 | $55,100 | $227,700 |
| 2024 | $2,877 | $278,500 | $55,100 | $223,400 |
| 2023 | $2,869 | $278,500 | $55,100 | $223,400 |
| 2022 | $2,962 | $287,600 | $55,100 | $232,500 |
| 2021 | $2,961 | $287,500 | $25,100 | $262,400 |
| 2020 | $2,714 | $264,500 | $25,100 | $239,400 |
| 2019 | $2,460 | $239,800 | $25,100 | $214,700 |
| 2018 | $2,392 | $237,800 | $25,100 | $212,700 |
| 2017 | $2,240 | $222,700 | $25,100 | $197,600 |
| 2016 | $2,188 | $220,800 | $25,100 | $195,700 |
| 2015 | $1,889 | $189,700 | $25,100 | $164,600 |
| 2014 | $1,874 | $188,200 | $25,100 | $163,100 |
Source: Public Records
Map
Nearby Homes
- 1317 S Walter Reed Dr Unit 17201
- 1315 S Walter Reed Dr Unit 204
- 2904 13th Rd S Unit 301
- 1400 S Edgewood St Unit 527
- 3202 13th Rd S
- 3135 14th St S
- 1415 S Edgewood St Unit 458
- 1415 S Edgewood St Unit 463
- 2807 16th Rd S Unit A
- 1400 S Barton St Unit 425
- 2600 16th St S Unit 711
- 1500 S Barton St Unit 595
- 3115 19th St S
- 1021 S Barton St Unit 120
- 1016 S Wayne St Unit 604
- 919 S Monroe St
- 1712 S Nelson St
- 3007 20th Ct S
- 1943 S Lowell St
- The Parker Plan at Bradbury Square by BCN
- 2912 13th Rd S Unit 12201
- 2912 13th Rd S Unit 12203
- 2912 13th Rd S Unit 12102
- 2912 13th Rd S Unit 12104
- 2912 13th Rd S Unit 12202
- 2912 13th Rd S Unit 12103
- 2912 13th Rd S Unit 12101
- 2912 13th Rd S Unit 102
- 2912 13th Rd S Unit 201
- 2912 13th Rd S Unit 203
- 2912 13th Rd S Unit 204
- 2912 13th Rd S Unit 202
- 2908 13th Rd S Unit 8101
- 2908 13th Rd S Unit 8202
- 2908 13th Rd S Unit 8201
- 2908 13th Rd S Unit 8102
- 2908 13th Rd S Unit 5081
- 2908 13th Rd S Unit 202
- 2908 13th Rd S Unit 1
- 2910 13th Rd S Unit 301