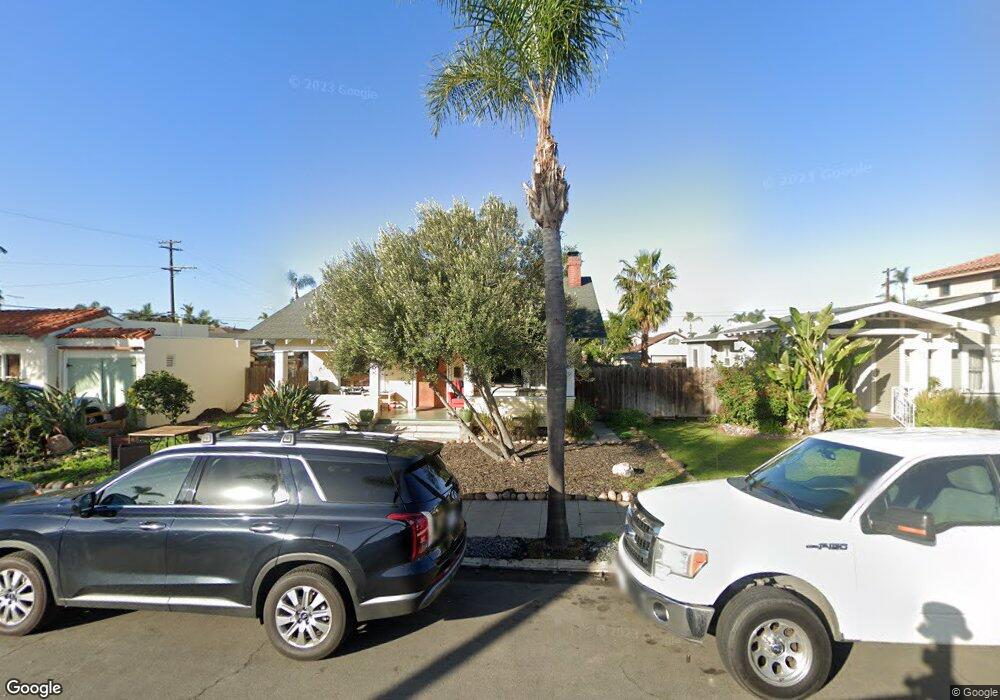
2912 29th St San Diego, CA 92104
North Park NeighborhoodEstimated Value: $1,274,682 - $1,406,000
3
Beds
1
Bath
1,380
Sq Ft
$961/Sq Ft
Est. Value
About This Home
This home is located at 2912 29th St, San Diego, CA 92104 and is currently estimated at $1,325,671, approximately $960 per square foot. 2912 29th St is a home located in San Diego County with nearby schools including McKinley Elementary School, Roosevelt International Middle School, and Mcgill School Of Success.
Ownership History
Date
Name
Owned For
Owner Type
Purchase Details
Closed on
May 11, 1998
Sold by
Peralta Gloria I
Bought by
Mccann Francis W
Current Estimated Value
Home Financials for this Owner
Home Financials are based on the most recent Mortgage that was taken out on this home.
Original Mortgage
$147,000
Outstanding Balance
$28,798
Interest Rate
7.13%
Estimated Equity
$1,296,873
Purchase Details
Closed on
May 4, 1998
Sold by
Mccann Francis W and Mccann Geraldine M
Bought by
Cook Rick and Smith Owen G
Home Financials for this Owner
Home Financials are based on the most recent Mortgage that was taken out on this home.
Original Mortgage
$147,000
Outstanding Balance
$28,798
Interest Rate
7.13%
Estimated Equity
$1,296,873
Create a Home Valuation Report for This Property
The Home Valuation Report is an in-depth analysis detailing your home's value as well as a comparison with similar homes in the area
Home Values in the Area
Average Home Value in this Area
Purchase History
| Date | Buyer | Sale Price | Title Company |
|---|---|---|---|
| Mccann Francis W | -- | First American Title Ins Co | |
| Edgell Gerry M | -- | First American Title Ins Co | |
| Cook Rick | $187,000 | First American Title Ins Co |
Source: Public Records
Mortgage History
| Date | Status | Borrower | Loan Amount |
|---|---|---|---|
| Open | Cook Rick | $147,000 |
Source: Public Records
Tax History Compared to Growth
Tax History
| Year | Tax Paid | Tax Assessment Tax Assessment Total Assessment is a certain percentage of the fair market value that is determined by local assessors to be the total taxable value of land and additions on the property. | Land | Improvement |
|---|---|---|---|---|
| 2025 | $3,662 | $298,570 | $215,550 | $83,020 |
| 2024 | $3,662 | $292,717 | $211,324 | $81,393 |
| 2023 | $3,580 | $286,979 | $207,181 | $79,798 |
| 2022 | $3,483 | $281,353 | $203,119 | $78,234 |
| 2021 | $3,458 | $275,837 | $199,137 | $76,700 |
| 2020 | $3,417 | $273,010 | $197,096 | $75,914 |
| 2019 | $3,356 | $267,658 | $193,232 | $74,426 |
| 2018 | $3,140 | $262,411 | $189,444 | $72,967 |
| 2017 | $80 | $257,267 | $185,730 | $71,537 |
| 2016 | $3,015 | $252,224 | $182,089 | $70,135 |
| 2015 | $2,971 | $248,436 | $179,354 | $69,082 |
| 2014 | $2,925 | $243,570 | $175,841 | $67,729 |
Source: Public Records
Map
Nearby Homes
- 2748 30th St
- 2950 Nutmeg St
- 3005 Olive St
- 2931 Thorn St
- 3132 31st St
- 3129 Redwood St
- 0 35th St
- 3376 30th St
- 2433 San Marcos Ave
- 3365-69 Grim Ave
- 3365 Grim Ave
- 3124-26 32nd St
- 3414 Villa Terrace
- 3045-49 Juniper St
- 3274 Redwood St
- 2144 30th St
- 2126-34 30th St
- 3509-11 32nd St
- 3533 Louisiana St
- 3537 Louisiana St