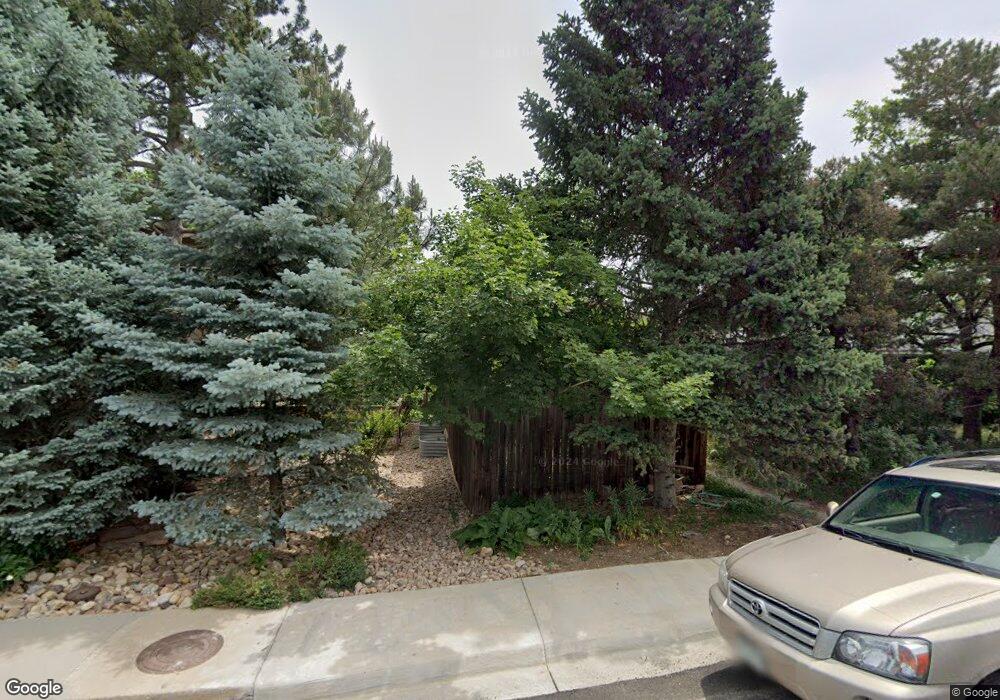
2912 6th St Boulder, CO 80304
Newlands NeighborhoodEstimated Value: $1,249,000 - $1,998,000
About This Home
This home is located at 2912 6th St, Boulder, CO 80304 and is currently estimated at $1,518,796, approximately $1,139 per square foot. 2912 6th St is a home located in Boulder County with nearby schools including Foothill Elementary School, Casey Middle School, and Boulder High School.
Ownership History
We collect this data history from publicly available records. To have your information removed, we recommend requesting removal directly through your county’s website.
Purchase Details
Purchase Details
Purchase Details
Purchase Details
Purchase Details
Purchase Details
Home Values in the Area
Average Home Value in this Area
Purchase History
We collect this data history from publicly available records. To have your information removed, we recommend requesting removal directly through your county’s website.
| Date | Buyer | Sale Price | Title Company |
|---|---|---|---|
| -- | -- | ||
| $136,500 | -- | ||
| -- | -- | ||
| -- | -- | ||
| $69,000 | -- | ||
| -- | -- |
Tax History
We collect this data history from publicly available records. To have your information removed, we recommend requesting removal directly through your county’s website.
| Year | Tax Paid | Tax Assessment Tax Assessment Total Assessment is a certain percentage of the fair market value that is determined by local assessors to be the total taxable value of land and additions on the property. | Land | Improvement |
|---|---|---|---|---|
| 2025 | $7,779 | $95,567 | $86,010 | $9,557 |
| 2024 | $8,050 | $87,838 | $79,054 | $8,784 |
| 2023 | $7,911 | $98,302 | $91,789 | $10,199 |
| 2022 | $6,507 | $77,020 | $69,318 | $7,702 |
| 2021 | $6,205 | $79,237 | $71,313 | $7,924 |
| 2020 | $5,687 | $72,480 | $57,987 | $14,493 |
| 2019 | $5,600 | $72,480 | $57,987 | $14,493 |
| 2018 | $4,884 | $63,533 | $50,832 | $12,701 |
| 2017 | $4,731 | $70,239 | $56,198 | $14,041 |
| 2016 | $4,474 | $59,644 | $46,168 | $13,476 |
| 2015 | $4,889 | $49,607 | $21,572 | $28,035 |
| 2014 | $4,171 | $49,607 | $21,572 | $28,035 |
Map
- 2958 6th St
- 675 Dellwood Ave
- 515 Alpine Ave
- 815 Alpine Ave Unit 2
- 507 Valley View Dr
- 810 Alpine Ave
- 501 Evergreen Ave
- 3015 3rd St
- 2675 Dakota Place Unit Newlands
- 3033 3rd St
- 2915 11th St
- 534 Dewey Ave
- 315 Evergreen Ave
- 804 Dewey Ave
- 1120 Alpine Ave
- 3123 3rd St
- 3181 9th St
- 900 Portland Place
- 946 Portland Place
- 1201 Balsam Ave Unit 206
Ask me questions while you tour the home.