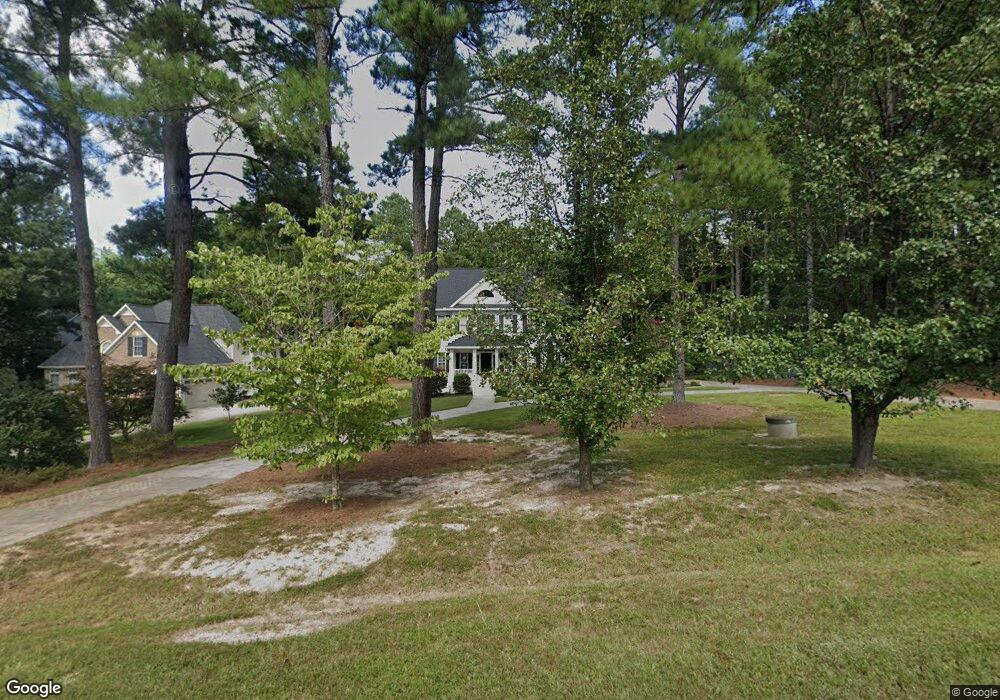
2912 Candlehurst Ln Raleigh, NC 27616
Estimated Value: $547,000 - $600,000
4
Beds
3
Baths
2,680
Sq Ft
$212/Sq Ft
Est. Value
About This Home
This home is located at 2912 Candlehurst Ln, Raleigh, NC 27616 and is currently estimated at $566,987, approximately $211 per square foot. 2912 Candlehurst Ln is a home located in Wake County with nearby schools including Forestville Road Elementary School, Neuse River Middle School, and Knightdale High.
Ownership History
Date
Name
Owned For
Owner Type
Purchase Details
Closed on
Aug 19, 2011
Sold by
Thompson David and Thompson Carol
Bought by
Fair James
Current Estimated Value
Home Financials for this Owner
Home Financials are based on the most recent Mortgage that was taken out on this home.
Original Mortgage
$225,000
Outstanding Balance
$156,150
Interest Rate
4.62%
Mortgage Type
New Conventional
Estimated Equity
$410,837
Purchase Details
Closed on
Sep 6, 2002
Sold by
Eci Custom Homes Inc
Bought by
Thompson David P and Thompson Carol A
Home Financials for this Owner
Home Financials are based on the most recent Mortgage that was taken out on this home.
Original Mortgage
$216,800
Interest Rate
5.75%
Purchase Details
Closed on
Jan 29, 2002
Sold by
Kirby Marshburn Bldg Corp
Bought by
Eci Custom Homes Inc
Create a Home Valuation Report for This Property
The Home Valuation Report is an in-depth analysis detailing your home's value as well as a comparison with similar homes in the area
Home Values in the Area
Average Home Value in this Area
Purchase History
| Date | Buyer | Sale Price | Title Company |
|---|---|---|---|
| Fair James | $250,000 | None Available | |
| Thompson David P | $272,000 | -- | |
| Eci Custom Homes Inc | $35,000 | -- |
Source: Public Records
Mortgage History
| Date | Status | Borrower | Loan Amount |
|---|---|---|---|
| Open | Fair James | $225,000 | |
| Previous Owner | Thompson David P | $216,800 | |
| Closed | Thompson David P | $40,750 |
Source: Public Records
Tax History Compared to Growth
Tax History
| Year | Tax Paid | Tax Assessment Tax Assessment Total Assessment is a certain percentage of the fair market value that is determined by local assessors to be the total taxable value of land and additions on the property. | Land | Improvement |
|---|---|---|---|---|
| 2025 | $3,368 | $523,392 | $100,000 | $423,392 |
| 2024 | $3,270 | $523,392 | $100,000 | $423,392 |
| 2023 | $2,341 | $297,657 | $65,000 | $232,657 |
| 2022 | $2,170 | $297,657 | $65,000 | $232,657 |
| 2021 | $2,112 | $297,657 | $65,000 | $232,657 |
| 2020 | $2,077 | $297,657 | $65,000 | $232,657 |
| 2019 | $2,336 | $283,564 | $50,000 | $233,564 |
| 2018 | $2,148 | $283,564 | $50,000 | $233,564 |
| 2017 | $2,036 | $283,564 | $50,000 | $233,564 |
| 2016 | $1,995 | $283,564 | $50,000 | $233,564 |
| 2015 | $2,067 | $294,762 | $50,000 | $244,762 |
| 2014 | -- | $294,762 | $50,000 | $244,762 |
Source: Public Records
Map
Nearby Homes
- 4355 Laurel Pond Way
- 4347 Laurel Pond Way
- 4342 Laurel Pond Way
- 4339 Laurel Pond Way
- 4335 Laurel Pond Way
- 4313 Laurel Pond Way
- 4301 Laurel Pond Way
- Mayflower III Plan at Everlee - Summit Collection
- Carson II Plan at Everlee - Designer Collection
- 4351 Laurel Pond Way
- 4358 Laurel Pond Way
- 4331 Laurel Pond Way
- Clayton III Plan at Everlee - Summit Collection
- 4325 Laurel Pond Way
- 4343 Laurel Pond Way
- Landrum III Plan at Everlee - Summit Collection
- 4306 Laurel Pond Way
- 4326 Laurel Pond Way
- Tryon III Plan at Everlee - Summit Collection
- 4330 Laurel Pond Way
- 2916 Candlehurst Ln
- 4401 Thistlehill Ct
- 2920 Candlehurst Ln
- 4405 Thistlehill Ct
- 2909 Candlehurst Ln
- 2913 Candlehurst Ln
- 2924 Candlehurst Ln
- 4413 Thistlehill Ct
- 4313 Thistlehill Ct
- 2917 Candlehurst Ln
- 2928 Candlehurst Ln
- 4309 Thistlehill Ct
- 2921 Candlehurst Ln
- 4404 Thistlehill Ct
- 4417 Thistlehill Ct
- 2933 Candlehurst Ln
- 4408 Thistlehill Ct
- 4421 Thistlehill Ct
- 4305 Thistlehill Ct
- 2801 Candlehurst Ln