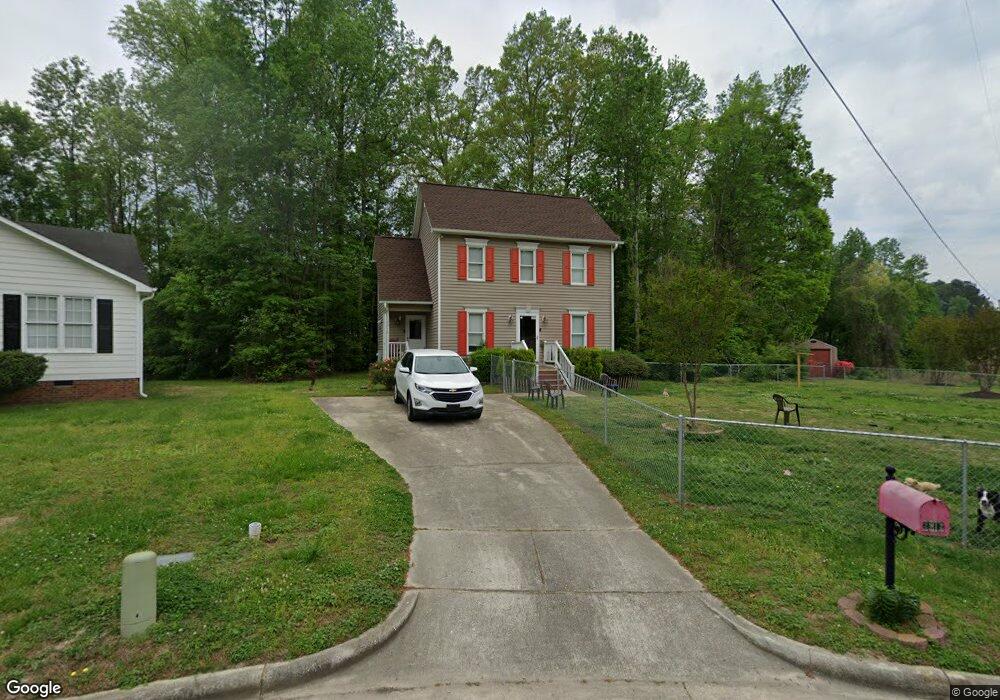
2912 Deeda Ct Raleigh, NC 27610
Southeast Raleigh NeighborhoodEstimated Value: $294,000 - $299,379
3
Beds
3
Baths
1,250
Sq Ft
$237/Sq Ft
Est. Value
About This Home
This home is located at 2912 Deeda Ct, Raleigh, NC 27610 and is currently estimated at $296,095, approximately $236 per square foot. 2912 Deeda Ct is a home located in Wake County with nearby schools including Barwell Road Elementary School, East Garner Middle School, and South Garner High.
Ownership History
Date
Name
Owned For
Owner Type
Purchase Details
Closed on
Oct 3, 2016
Sold by
Council Antoinette and Council Markeith
Bought by
Hines Miketta and Hines Amanda
Current Estimated Value
Purchase Details
Closed on
Feb 10, 2010
Sold by
Barrett Tarah
Bought by
Davis Antoinette Lynne
Home Financials for this Owner
Home Financials are based on the most recent Mortgage that was taken out on this home.
Original Mortgage
$111,935
Interest Rate
5.5%
Mortgage Type
FHA
Purchase Details
Closed on
Feb 8, 2008
Sold by
Pearson Tanya B and Pearson Jermall J
Bought by
Barrett Tarah
Home Financials for this Owner
Home Financials are based on the most recent Mortgage that was taken out on this home.
Original Mortgage
$119,605
Interest Rate
6.06%
Mortgage Type
Purchase Money Mortgage
Purchase Details
Closed on
Mar 31, 2003
Sold by
Kea Gretchen R
Bought by
Hinton Tanya B and Pearson Jermall J
Home Financials for this Owner
Home Financials are based on the most recent Mortgage that was taken out on this home.
Original Mortgage
$107,054
Interest Rate
5.82%
Mortgage Type
FHA
Create a Home Valuation Report for This Property
The Home Valuation Report is an in-depth analysis detailing your home's value as well as a comparison with similar homes in the area
Home Values in the Area
Average Home Value in this Area
Purchase History
| Date | Buyer | Sale Price | Title Company |
|---|---|---|---|
| Hines Miketta | $133,000 | None Available | |
| Davis Antoinette Lynne | $114,000 | Sterling Title Company | |
| Barrett Tarah | $126,000 | None Available | |
| Hinton Tanya B | $108,000 | -- |
Source: Public Records
Mortgage History
| Date | Status | Borrower | Loan Amount |
|---|---|---|---|
| Previous Owner | Davis Antoinette Lynne | $111,935 | |
| Previous Owner | Barrett Tarah | $119,605 | |
| Previous Owner | Hinton Tanya B | $107,054 | |
| Closed | Hines Miketta | $0 |
Source: Public Records
Tax History Compared to Growth
Tax History
| Year | Tax Paid | Tax Assessment Tax Assessment Total Assessment is a certain percentage of the fair market value that is determined by local assessors to be the total taxable value of land and additions on the property. | Land | Improvement |
|---|---|---|---|---|
| 2025 | $2,625 | $298,755 | $115,000 | $183,755 |
| 2024 | $2,615 | $298,755 | $115,000 | $183,755 |
| 2023 | $1,641 | $148,716 | $43,000 | $105,716 |
| 2022 | $1,526 | $148,716 | $43,000 | $105,716 |
| 2021 | $1,467 | $148,716 | $43,000 | $105,716 |
| 2020 | $1,441 | $148,716 | $43,000 | $105,716 |
| 2019 | $1,272 | $108,032 | $25,000 | $83,032 |
| 2018 | $1,200 | $108,032 | $25,000 | $83,032 |
| 2017 | $1,144 | $108,032 | $25,000 | $83,032 |
| 2016 | $1,121 | $108,032 | $25,000 | $83,032 |
| 2015 | $1,221 | $115,980 | $32,000 | $83,980 |
| 2014 | $1,159 | $115,980 | $32,000 | $83,980 |
Source: Public Records
Map
Nearby Homes
- 5612 Tealbrook Dr
- 5808 Carretta Ct
- 5600 Brandycrest Dr
- 3316 Perkins Ridge Rd
- 2601 Baxley Dr
- 2700 Barrington Dr
- 5512 Quitman Trail
- 3205 Vallejo Trail
- 6420 Hatchies Dr
- 5305 Tomahawk Trail
- 2425 Abbeyhill Dr Unit 10
- 5849 Ricker Rd
- 6005 Namozine Ct
- 2404 Fleming Stone Ln
- 2404 Fleming Stone Ln Unit 51
- 2408 Fleming Stone Ln Unit 50
- 2408 Fleming Stone Ln
- 2400 Flemingstone Ln Unit 52
- 2412 Fleming Stone Ln Unit 49
- 5101 Royal Acres Rd
- 2916 Deeda Ct
- 5612 Rudolph Ct
- 5705 Tealbrook Dr
- 5709 Tealbrook Dr
- 5713 Tealbrook Dr
- 5701 Tealbrook Dr
- 2920 Deeda Ct
- 2909 Deeda Ct
- 5608 Rudolph Ct
- 5717 Tealbrook Dr
- 2913 Deeda Ct
- 2905 Deeda Ct
- 5721 Tealbrook Dr
- 5604 Rudolph Ct
- 2908 Barwell Rd
- 5704 Tealbrook Dr
- 5708 Tealbrook Dr
- 5725 Tealbrook Dr
- 5706 Tealbrook Dr
- 5661 Tealbrook Dr