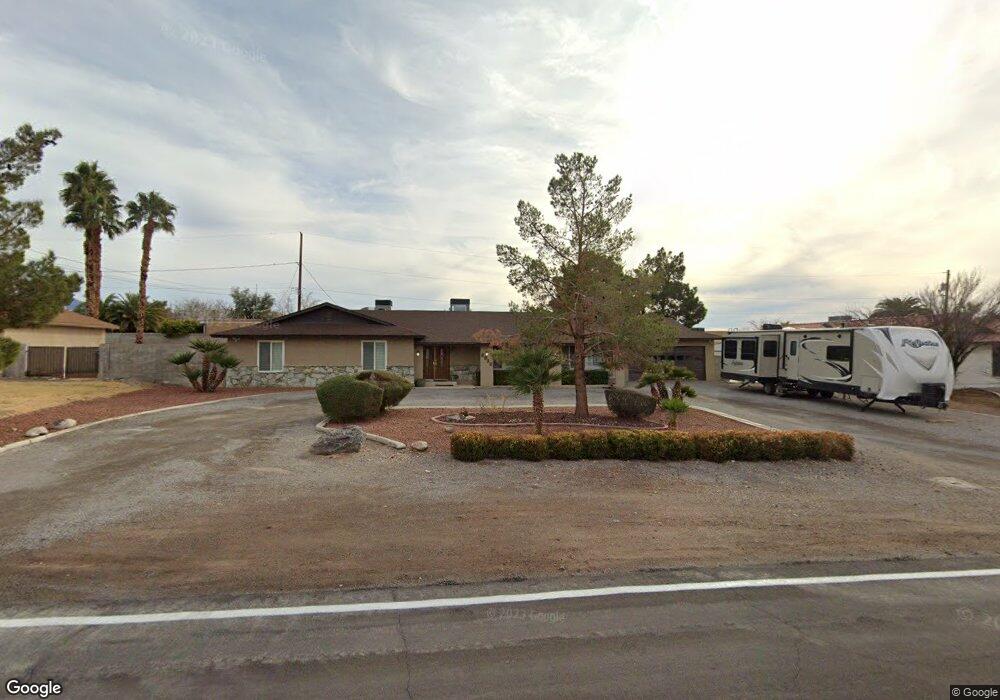
2912 Delano Dr Henderson, NV 89074
Green Valley South NeighborhoodEstimated Value: $615,000 - $734,000
4
Beds
2
Baths
2,296
Sq Ft
$295/Sq Ft
Est. Value
About This Home
This home is located at 2912 Delano Dr, Henderson, NV 89074 and is currently estimated at $678,138, approximately $295 per square foot. 2912 Delano Dr is a home located in Clark County with nearby schools including John Vanderburg Elementary School, Neil C. Twitchell Elementary School, and Bob Miller Middle School.
Ownership History
Date
Name
Owned For
Owner Type
Purchase Details
Closed on
Apr 23, 2019
Sold by
Hitchcock William Wayne
Bought by
Hitchcock Trust
Current Estimated Value
Purchase Details
Closed on
Apr 2, 2019
Sold by
Hitchcock William Wayne
Bought by
Hitchcock William Wayne
Purchase Details
Closed on
Aug 23, 2012
Sold by
Heyboer Sandi S
Bought by
Heyboer Sandi and Smith Heyboer Trust
Create a Home Valuation Report for This Property
The Home Valuation Report is an in-depth analysis detailing your home's value as well as a comparison with similar homes in the area
Home Values in the Area
Average Home Value in this Area
Purchase History
| Date | Buyer | Sale Price | Title Company |
|---|---|---|---|
| Hitchcock Trust | -- | None Available | |
| Hitchcock William Wayne | -- | None Available | |
| Heyboer Sandi | -- | None Available |
Source: Public Records
Tax History
| Year | Tax Paid | Tax Assessment Tax Assessment Total Assessment is a certain percentage of the fair market value that is determined by local assessors to be the total taxable value of land and additions on the property. | Land | Improvement |
|---|---|---|---|---|
| 2026 | $2,231 | $143,223 | $98,000 | $45,223 |
| 2025 | $2,166 | $144,863 | $98,000 | $46,863 |
| 2024 | $2,103 | $144,863 | $98,000 | $46,863 |
| 2023 | $2,103 | $116,024 | $70,000 | $46,024 |
| 2022 | $2,042 | $107,676 | $64,750 | $42,926 |
| 2021 | $1,983 | $97,514 | $56,000 | $41,514 |
| 2020 | $1,922 | $94,285 | $52,500 | $41,785 |
| 2019 | $1,899 | $90,791 | $49,000 | $41,791 |
| 2018 | $1,812 | $84,641 | $43,750 | $40,891 |
| 2017 | $2,143 | $73,931 | $35,000 | $38,931 |
| 2016 | $1,698 | $70,387 | $28,000 | $42,387 |
| 2015 | $1,694 | $63,294 | $21,000 | $42,294 |
| 2014 | $1,644 | $55,077 | $14,000 | $41,077 |
Source: Public Records
Map
Nearby Homes
- 2916 Candelaria Dr
- 3020 Delano Dr
- 0 Delano Dr
- 0 Richmar Ave
- 2827 Richmar Ave
- 386 Cactus River Ct
- 9230 Sapphire Hills Ct
- 420 Rhythm St
- 425 Rhythm St
- 2899 Evergold Dr
- 504 Recognition Place
- 2701 Copper Cove Dr
- 0 Mcleod Dr Unit 2753083
- 8953 Belconte Ln
- 2196 Pescara Ct
- 2300 E Silverado Ranch Blvd Unit 2161
- 2300 E Silverado Ranch Blvd Unit 1133
- 2300 E Silverado Ranch Blvd Unit 1021
- 2300 E Silverado Ranch Blvd Unit 1180
- 2300 E Silverado Ranch Blvd Unit 2158
- 2908 Delano Dr
- 2916 Delano Dr
- 2911 Richmar Ave
- 2911 Delano Dr
- 2907 Richmar Ave
- 2915 Delano Dr
- 2920 Delano Dr
- 2907 Delano Dr
- 2904 Delano Dr
- 2919 Richmar Ave
- 2903 Delano Dr
- 2919 Delano Dr
- 2912 Candelaria Dr
- 3018 Delano Dr
- 3028 Delano Dr
- 2832 Delano Dr
- 2908 Candelaria Dr
- 2914 Richmar Ave
- 2916 Richmar Ave
Your Personal Tour Guide
Ask me questions while you tour the home.