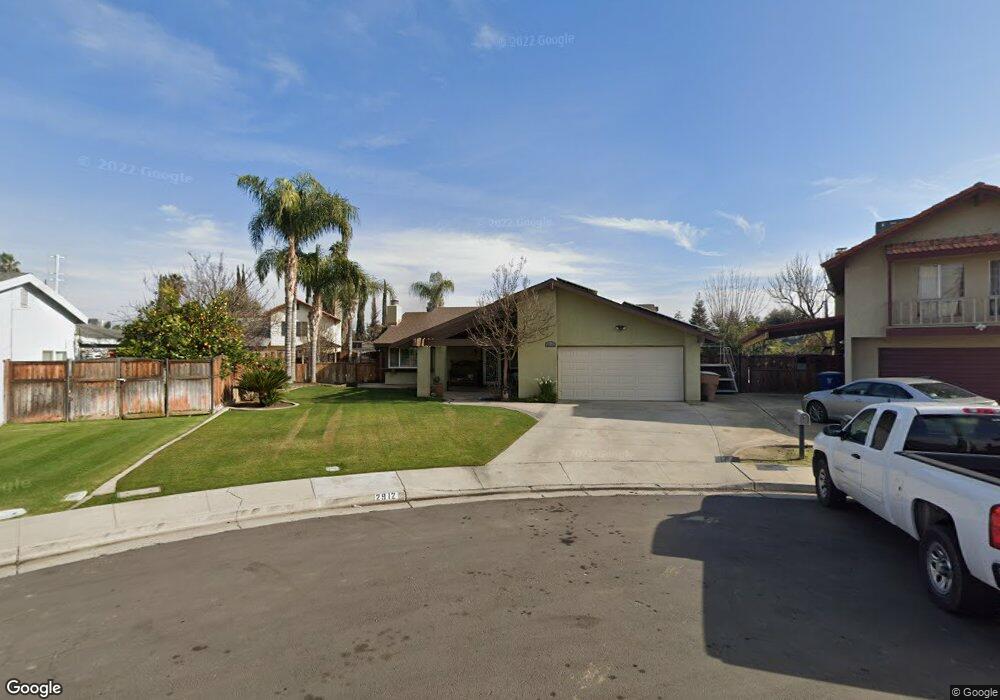
2912 Foxboro Ct Unit A Bakersfield, CA 93309
Southwest Bakersfield NeighborhoodEstimated Value: $204,440 - $361,000
3
Beds
2
Baths
1,487
Sq Ft
$172/Sq Ft
Est. Value
About This Home
This home is located at 2912 Foxboro Ct Unit A, Bakersfield, CA 93309 and is currently estimated at $255,110, approximately $171 per square foot. 2912 Foxboro Ct Unit A is a home located in Kern County with nearby schools including Stine Elementary School, Fred L. Thompson Junior High School, and West High School.
Ownership History
Date
Name
Owned For
Owner Type
Purchase Details
Closed on
Apr 22, 2025
Sold by
Kuster Jason and Kuster Sandra
Bought by
Kuster Sandra and Quintana Melissa
Current Estimated Value
Home Financials for this Owner
Home Financials are based on the most recent Mortgage that was taken out on this home.
Original Mortgage
$205,000
Outstanding Balance
$204,090
Interest Rate
6.65%
Mortgage Type
New Conventional
Estimated Equity
$51,020
Purchase Details
Closed on
Jan 15, 2008
Sold by
Kuster Patsy A
Bought by
Kuster Jason and Kuster Sandra
Home Financials for this Owner
Home Financials are based on the most recent Mortgage that was taken out on this home.
Original Mortgage
$100,500
Interest Rate
6.07%
Mortgage Type
Purchase Money Mortgage
Purchase Details
Closed on
Mar 9, 2007
Sold by
Kuster Patsy A
Bought by
Kuster Patsy A and Kuster Jason
Create a Home Valuation Report for This Property
The Home Valuation Report is an in-depth analysis detailing your home's value as well as a comparison with similar homes in the area
Home Values in the Area
Average Home Value in this Area
Purchase History
| Date | Buyer | Sale Price | Title Company |
|---|---|---|---|
| Kuster Sandra | $205,000 | Ticor Title Company | |
| Kuster Jason | $68,000 | Chicago Title Company | |
| Kuster Patsy A | -- | None Available |
Source: Public Records
Mortgage History
| Date | Status | Borrower | Loan Amount |
|---|---|---|---|
| Open | Kuster Sandra | $205,000 | |
| Previous Owner | Kuster Jason | $100,500 |
Source: Public Records
Tax History Compared to Growth
Tax History
| Year | Tax Paid | Tax Assessment Tax Assessment Total Assessment is a certain percentage of the fair market value that is determined by local assessors to be the total taxable value of land and additions on the property. | Land | Improvement |
|---|---|---|---|---|
| 2025 | $2,772 | $181,364 | $27,713 | $153,651 |
| 2024 | $2,772 | $177,809 | $27,170 | $150,639 |
| 2023 | $2,725 | $174,324 | $26,638 | $147,686 |
| 2022 | $2,613 | $170,907 | $26,116 | $144,791 |
| 2021 | $2,500 | $167,556 | $25,604 | $141,952 |
| 2020 | $2,451 | $165,839 | $25,342 | $140,497 |
| 2019 | $2,418 | $165,839 | $25,342 | $140,497 |
| 2018 | $2,312 | $159,402 | $24,359 | $135,043 |
| 2017 | $2,277 | $156,278 | $23,882 | $132,396 |
| 2016 | $2,136 | $153,214 | $23,414 | $129,800 |
| 2015 | $2,115 | $150,914 | $23,063 | $127,851 |
| 2014 | $2,078 | $147,959 | $22,612 | $125,347 |
Source: Public Records
Map
Nearby Homes
- 2808 Edmonton St
- 4608 Posada Ave
- 3104 Summer Side Ct
- 5001 Appleblossom Dr
- 4517 Meadowlark Way
- 2600 Layton Dr
- 2608 Hallisey St
- 3900 Rickey Way
- 5009 Stormy Ct
- 4701 Misty Ct
- 3813 Rickey Way
- 2213 Sandpiper Rd
- 3535 Stine Rd Unit 159
- 3535 Stine Rd Unit 69
- 3535 Stine Rd Unit 149
- 3535 Stine Rd Unit 104
- 3535 Stine Rd Unit 177
- 3535 Stine Rd Unit 14
- 3535 Stine Rd Unit 17
- 3535 Stine Rd Unit 78
- 2916 Foxboro Ct Unit A
- 2908 Foxboro Ct
- 2913 Estero St
- 2909 Estero St
- 3001 Estero St Unit B
- 2905 Estero St Unit B
- 3005 Estero St
- 2917 Foxboro Ct
- 4605 Hahn Ave
- 4604 Santanna Ave
- 4609 Hahn Ave Unit A
- 4608 Santanna Ave
- 2909 Foxboro Ct
- 2913 Foxboro Ct
- 4612 Santanna Ave Unit C
- 2901 Estero St
- 3009 Estero St
- 2905 Foxboro Ct
- 4616 Santanna Ave
- 2912 Estero St