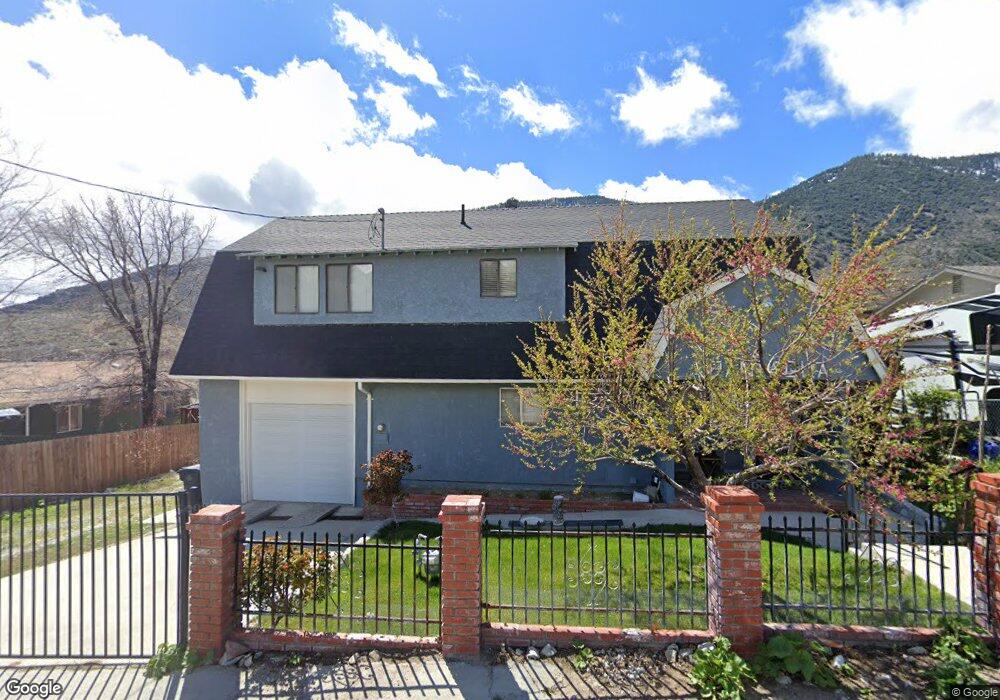
2912 Johnson Rd Frazier Park, CA 93225
Estimated Value: $311,000 - $358,000
3
Beds
2
Baths
1,568
Sq Ft
$208/Sq Ft
Est. Value
About This Home
This home is located at 2912 Johnson Rd, Frazier Park, CA 93225 and is currently estimated at $326,220, approximately $208 per square foot. 2912 Johnson Rd is a home located in Kern County with nearby schools including Frazier Park Elementary School, El Tejon Elementary School, and Frazier Mountain High School.
Ownership History
Date
Name
Owned For
Owner Type
Purchase Details
Closed on
Jul 6, 2010
Sold by
Slagle Kenneth J
Bought by
Paniagua Tomas and Paniagua Refugio
Current Estimated Value
Home Financials for this Owner
Home Financials are based on the most recent Mortgage that was taken out on this home.
Original Mortgage
$84,000
Outstanding Balance
$55,258
Interest Rate
4.52%
Mortgage Type
New Conventional
Estimated Equity
$270,962
Purchase Details
Closed on
Apr 16, 2010
Sold by
Slagle Kenneth J and Slagle Heidi L
Bought by
Bank Of America National Association
Purchase Details
Closed on
Mar 4, 2010
Sold by
Slagle Heidi L
Bought by
Slagle Kenneth J
Purchase Details
Closed on
Sep 20, 2004
Sold by
Kolbeins Howard B and Kolbeins Juliana
Bought by
Slagle Kenneth J and Slagle Heidi L
Home Financials for this Owner
Home Financials are based on the most recent Mortgage that was taken out on this home.
Original Mortgage
$160,000
Interest Rate
4.5%
Mortgage Type
Credit Line Revolving
Create a Home Valuation Report for This Property
The Home Valuation Report is an in-depth analysis detailing your home's value as well as a comparison with similar homes in the area
Home Values in the Area
Average Home Value in this Area
Purchase History
| Date | Buyer | Sale Price | Title Company |
|---|---|---|---|
| Paniagua Tomas | $105,000 | Landamerica Commonwealth Tit | |
| Bank Of America National Association | $117,000 | Accommodation | |
| Slagle Kenneth J | -- | None Available | |
| Slagle Kenneth J | $200,000 | Ticor Title |
Source: Public Records
Mortgage History
| Date | Status | Borrower | Loan Amount |
|---|---|---|---|
| Open | Paniagua Tomas | $84,000 | |
| Previous Owner | Slagle Kenneth J | $160,000 | |
| Closed | Slagle Kenneth J | $40,000 |
Source: Public Records
Tax History Compared to Growth
Tax History
| Year | Tax Paid | Tax Assessment Tax Assessment Total Assessment is a certain percentage of the fair market value that is determined by local assessors to be the total taxable value of land and additions on the property. | Land | Improvement |
|---|---|---|---|---|
| 2025 | $1,624 | $134,510 | $32,023 | $102,487 |
| 2024 | $1,558 | $131,874 | $31,396 | $100,478 |
| 2023 | $1,558 | $129,289 | $30,781 | $98,508 |
| 2022 | $1,555 | $126,755 | $30,178 | $96,577 |
| 2021 | $1,478 | $124,271 | $29,587 | $94,684 |
| 2020 | $1,437 | $122,998 | $29,284 | $93,714 |
| 2019 | $1,426 | $122,998 | $29,284 | $93,714 |
| 2018 | $1,405 | $118,224 | $28,148 | $90,076 |
| 2017 | $1,324 | $115,907 | $27,597 | $88,310 |
| 2016 | $1,271 | $113,635 | $27,056 | $86,579 |
| 2015 | $1,276 | $111,929 | $26,650 | $85,279 |
| 2014 | $1,251 | $109,737 | $26,128 | $83,609 |
Source: Public Records
Map
Nearby Homes
- 2801 Johnson Rd
- 2801 Johnson Rd Unit 11
- 0 25903309003 San Fernando Trail Unit 25001791
- 3408 Iowa Trail
- 0 Santa Clara Trail Unit SR25126054
- 921 Piru Way
- 259 San Fernando Trail
- 3516 Illinois Trail
- 0 Iowa Unit SR25157035
- 0 Iowa Unit SR25078005
- 3624 Iowa Trail
- 3550 Ohio Trail
- 3432 California Trail
- 0 Escolon Unit SR23224294
- 3700 Kiwanis Trail
- 305 E End Dr
- 3704 Kiwanis Trail
- 3724 Encino Trail
- 3801 Los Padres Dr
- 3820 Rotary Trail
- 2916 Johnson Rd
- 2904 Johnson Rd
- 2913 Harriet Rd
- 2915 Johnson Rd
- 2917 Harriet Rd
- 2917 Harriet Rd
- 2905 Harriet Rd
- 2905 Harriet Rd
- 2919 Johnson Rd
- 3001 Harriet Rd
- 2400 Johns Rd
- 2929 Johnson Rd
- 2820 Johnson Rd
- 2901 Harriet Rd Lebec Rd
- 2825 Harriet Rd
- 2881 Johnson Rd
- 2916 Harriet Rd
- 2825 Johnson Rd
- 2908 Harriet Rd
- 2817 Harriet Rd