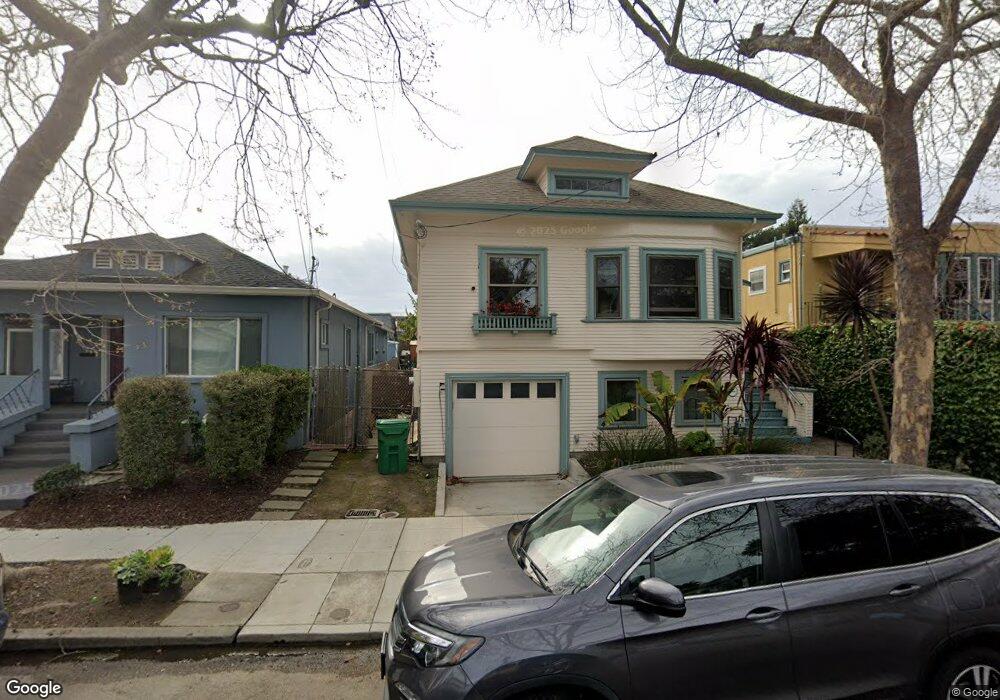
2912 King St Berkeley, CA 94703
South Berkeley NeighborhoodEstimated Value: $1,008,000 - $1,980,511
3
Beds
2
Baths
1,453
Sq Ft
$1,116/Sq Ft
Est. Value
About This Home
This home is located at 2912 King St, Berkeley, CA 94703 and is currently estimated at $1,621,128, approximately $1,115 per square foot. 2912 King St is a home located in Alameda County with nearby schools including Malcolm X Elementary School, Emerson Elementary School, and John Muir Elementary School.
Ownership History
Date
Name
Owned For
Owner Type
Purchase Details
Closed on
Oct 7, 2021
Sold by
Bigelow Nathan J and Hall Sarah L
Bought by
Bigelow Nathan J and Hall Sarah L
Current Estimated Value
Purchase Details
Closed on
May 10, 2016
Sold by
Sauceda Marjorie Alice and Estate Of Leroy Warren Douglas
Bought by
Bigelow Nathan J and Hall Sarah L
Home Financials for this Owner
Home Financials are based on the most recent Mortgage that was taken out on this home.
Original Mortgage
$880,000
Outstanding Balance
$698,710
Interest Rate
3.58%
Mortgage Type
New Conventional
Estimated Equity
$922,418
Purchase Details
Closed on
Jun 27, 2013
Sold by
Warren Sauceda Marjorie Alice and Warren Douglas Jr Leroy
Bought by
Warren Sauceda Marjorie Alice and Warren Douglas Jr Leroy
Purchase Details
Closed on
Sep 22, 1995
Sold by
Douglas Leroy W and Douglas Ida L
Bought by
Douglas Douglas Ida Louise Ida Louise and Douglas Ida Louise
Create a Home Valuation Report for This Property
The Home Valuation Report is an in-depth analysis detailing your home's value as well as a comparison with similar homes in the area
Home Values in the Area
Average Home Value in this Area
Purchase History
| Date | Buyer | Sale Price | Title Company |
|---|---|---|---|
| Bigelow Nathan J | -- | None Available | |
| Bigelow Nathan J | $1,100,000 | Chicago Title Company | |
| Warren Sauceda Marjorie Alice | -- | None Available | |
| Douglas Douglas Ida Louise Ida Louise | -- | -- |
Source: Public Records
Mortgage History
| Date | Status | Borrower | Loan Amount |
|---|---|---|---|
| Open | Bigelow Nathan J | $880,000 |
Source: Public Records
Tax History
| Year | Tax Paid | Tax Assessment Tax Assessment Total Assessment is a certain percentage of the fair market value that is determined by local assessors to be the total taxable value of land and additions on the property. | Land | Improvement |
|---|---|---|---|---|
| 2025 | $28,789 | $1,944,598 | $390,644 | $1,560,954 |
| 2024 | $28,789 | $1,906,335 | $382,984 | $1,530,351 |
| 2023 | $28,165 | $1,875,830 | $375,477 | $1,500,353 |
| 2022 | $28,670 | $1,832,050 | $368,115 | $1,470,935 |
| 2021 | $22,948 | $1,394,992 | $360,897 | $1,041,095 |
| 2020 | $19,444 | $1,190,661 | $357,198 | $833,463 |
| 2019 | $18,300 | $1,167,320 | $350,196 | $817,124 |
| 2018 | $17,973 | $1,144,440 | $343,332 | $801,108 |
| 2017 | $17,368 | $1,122,000 | $336,600 | $785,400 |
| 2016 | $4,027 | $41,629 | $24,853 | $16,776 |
| 2015 | $3,461 | $41,004 | $24,480 | $16,524 |
| 2014 | $3,354 | $40,201 | $24,001 | $16,200 |
Source: Public Records
Map
Nearby Homes
- 2926 Ellis St
- 1610 Oregon St
- 1646 Ashby Ave
- 1535 Julia St
- 1530 Stuart St
- 2727 McGee Ave
- 2701 Grant St
- 2790 Sacramento St
- 3110 California St
- 2782 Sacramento St
- 1507 Prince St
- 3114 California St
- 1741 Derby St
- 2774 Sacramento St
- 2758 Sacramento St
- 2750 Sacramento St
- 1450 Ward St
- 3101 Sacramento St
- 1612 Carleton St
- 1515 Derby St
- 2916 King St
- 2910 King St
- 2906 King St
- 1659 Julia St
- 1649 Julia St Unit C
- 1649 Julia St
- 1648 Russell St Unit 1
- 1648 Russell St
- 1656 Russell St Unit Upper
- 1656 Russell St
- 1652 Russell St
- 1645 Julia St
- 1662 Russell St
- 1641 Julia St
- 1646 Russell St
- 1654 Russell St Unit Lower
- 2911 King St
- 2915 King St
- 2909 King St
- 1656 Julia St
Your Personal Tour Guide
Ask me questions while you tour the home.