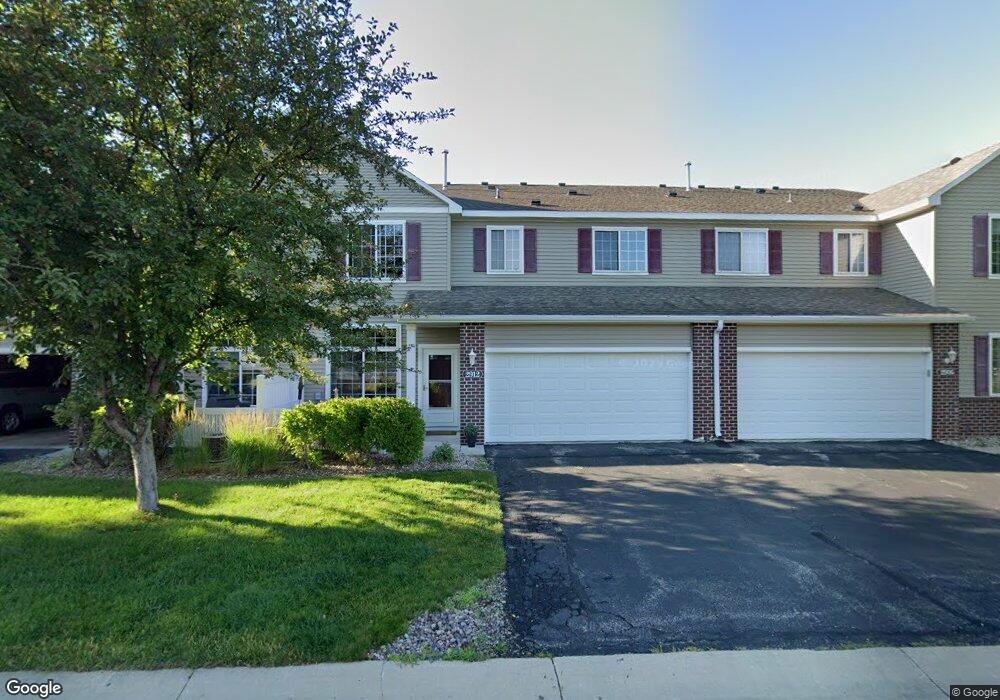
2912 Quartz Place NW Rochester, MN 55901
Estimated Value: $236,016 - $249,000
2
Beds
2
Baths
1,424
Sq Ft
$171/Sq Ft
Est. Value
About This Home
This home is located at 2912 Quartz Place NW, Rochester, MN 55901 and is currently estimated at $243,504, approximately $171 per square foot. 2912 Quartz Place NW is a home located in Olmsted County with nearby schools including Century Senior High School, Rochester Beacon Academy, and Rochester Arts & Sciences Academy.
Ownership History
Date
Name
Owned For
Owner Type
Purchase Details
Closed on
Jun 16, 2020
Sold by
Rohatgi Ram K and Nayar Saloni
Bought by
Heydt Karen G
Current Estimated Value
Home Financials for this Owner
Home Financials are based on the most recent Mortgage that was taken out on this home.
Original Mortgage
$179,550
Outstanding Balance
$159,157
Interest Rate
3.2%
Mortgage Type
New Conventional
Estimated Equity
$84,347
Purchase Details
Closed on
Sep 8, 2016
Sold by
Phillips Bernard E and Phillips Holly K
Bought by
Rohatgi Ram K and Nayar Saloni
Home Financials for this Owner
Home Financials are based on the most recent Mortgage that was taken out on this home.
Original Mortgage
$107,175
Interest Rate
3.43%
Mortgage Type
New Conventional
Purchase Details
Closed on
Feb 17, 2015
Sold by
Johnson Jamie Jamie
Bought by
Philipps Bernard Bernard
Create a Home Valuation Report for This Property
The Home Valuation Report is an in-depth analysis detailing your home's value as well as a comparison with similar homes in the area
Home Values in the Area
Average Home Value in this Area
Purchase History
| Date | Buyer | Sale Price | Title Company |
|---|---|---|---|
| Heydt Karen G | $189,000 | Edina Realty Title Inc | |
| Rohatgi Ram K | $142,900 | Hansen Title & Legal Svcs | |
| Philipps Bernard Bernard | $127,100 | -- |
Source: Public Records
Mortgage History
| Date | Status | Borrower | Loan Amount |
|---|---|---|---|
| Open | Heydt Karen G | $179,550 | |
| Previous Owner | Rohatgi Ram K | $107,175 |
Source: Public Records
Tax History Compared to Growth
Tax History
| Year | Tax Paid | Tax Assessment Tax Assessment Total Assessment is a certain percentage of the fair market value that is determined by local assessors to be the total taxable value of land and additions on the property. | Land | Improvement |
|---|---|---|---|---|
| 2024 | $2,804 | $222,200 | $35,000 | $187,200 |
| 2023 | $2,400 | $206,600 | $30,000 | $176,600 |
| 2022 | $2,122 | $196,000 | $30,000 | $166,000 |
| 2021 | $1,948 | $172,900 | $30,000 | $142,900 |
| 2020 | $1,940 | $160,900 | $30,000 | $130,900 |
| 2019 | $1,764 | $155,000 | $30,000 | $125,000 |
| 2018 | $1,596 | $144,000 | $25,000 | $119,000 |
| 2017 | $1,526 | $136,900 | $20,000 | $116,900 |
| 2016 | $1,442 | $100,400 | $15,900 | $84,500 |
| 2015 | $1,676 | $92,800 | $15,600 | $77,200 |
| 2014 | $1,634 | $119,300 | $20,000 | $99,300 |
| 2012 | -- | $125,600 | $20,000 | $105,600 |
Source: Public Records
Map
Nearby Homes
- 6229 30th Ave NW
- 6372 Bandel Ln NW
- 2416 62nd St NW
- 6120 Cody Ln NW
- 2205 67th St NW
- 6111 Cody Ln NW
- 6112 Cody Ln NW
- 6262 Cody Place NW
- 6246 Cody Place NW
- 6128 Cody Ln
- 6127 Cody Ln
- 6119 Cody Ln
- 6238 Cody Place NW
- 6230 Cody Place NW
- 6151 Cody Ln NW
- 6266 Jonathan Dr NW
- 6143 39th Ave NW
- XXXX 68th St NW
- L2B1 Boelter Estates Dr NW
- L1B1 Boelter Estates Dr NW
- 2912 2912 Quartz Place NW
- 2908 2908 Quartz Place NW
- 2908 Quartz Place NW
- 2901 2901 Slate-Court-nw
- 2901 2901 Slate Ct NW
- 2901 Slate Ct NW
- 2897 Slate Ct NW
- 2897 2897 Slate Ct NW
- 2916 2916 Quartz Place NW
- 2916 Quartz Place NW
- 2904 Quartz Place NW
- 2905 Slate Ct NW
- 2904 2904 Quartz-Place-nw
- 2904 2904 Quartz Place NW
- 2893 Slate Ct NW
- 2915 2915 Quartz-Place-nw
- 2911 Quartz Place NW
- 2907 Quartz Place NW
- 2911 2911 Quartz Place NW
- 2915 Quartz Place NW