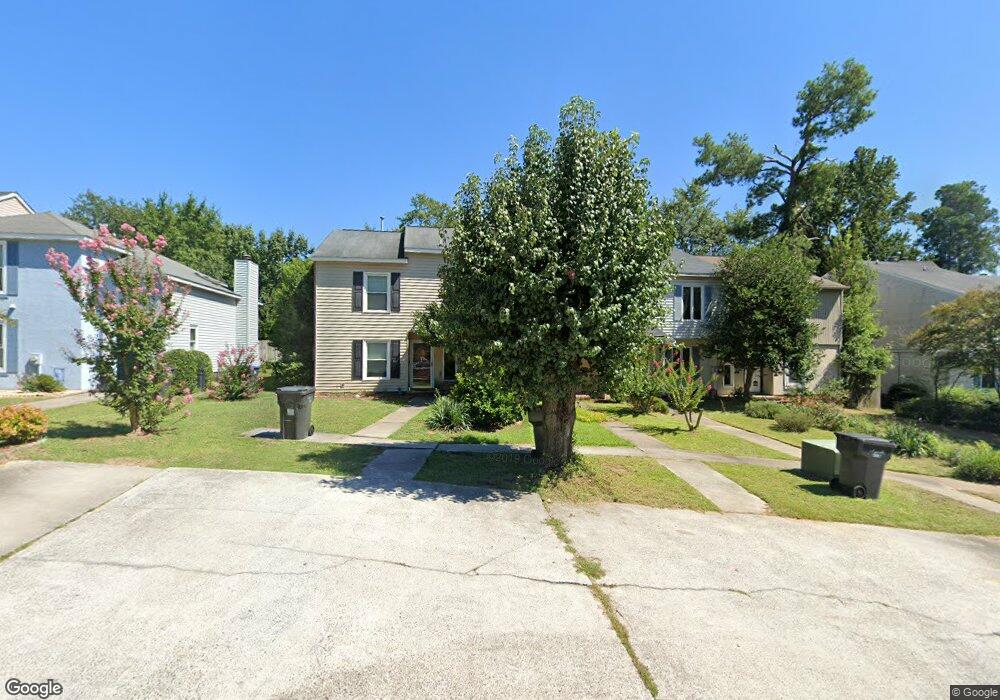
2912 Running Creek Ln Augusta, GA 30907
Montclair NeighborhoodEstimated Value: $172,423 - $189,000
2
Beds
2
Baths
1,380
Sq Ft
$130/Sq Ft
Est. Value
About This Home
This home is located at 2912 Running Creek Ln, Augusta, GA 30907 and is currently estimated at $179,856, approximately $130 per square foot. 2912 Running Creek Ln is a home located in Richmond County with nearby schools including First Coast Technical Institute, R.B. Hunt Elementary School, and Warren Road Elementary School.
Ownership History
Date
Name
Owned For
Owner Type
Purchase Details
Closed on
Jun 10, 2008
Sold by
Lamar Gregory
Bought by
Lamar Gregory and Lamar Shaunda
Current Estimated Value
Home Financials for this Owner
Home Financials are based on the most recent Mortgage that was taken out on this home.
Original Mortgage
$68,800
Interest Rate
6.02%
Mortgage Type
New Conventional
Purchase Details
Closed on
Aug 13, 2002
Sold by
Lamar Saundra
Bought by
Lamar Gregory
Purchase Details
Closed on
Feb 9, 1996
Sold by
Rhet-Anderson Rhet-Anderson and Rhet-Anderson Inves
Bought by
Lamar Saundra
Purchase Details
Closed on
Aug 15, 1991
Sold by
Parkes Edward N
Bought by
Watson K G
Create a Home Valuation Report for This Property
The Home Valuation Report is an in-depth analysis detailing your home's value as well as a comparison with similar homes in the area
Home Values in the Area
Average Home Value in this Area
Purchase History
| Date | Buyer | Sale Price | Title Company |
|---|---|---|---|
| Lamar Gregory | -- | Service Link | |
| Lamar Gregory | -- | -- | |
| Lamar Saundra | $71,300 | -- | |
| Watson K G | $52,900 | -- |
Source: Public Records
Mortgage History
| Date | Status | Borrower | Loan Amount |
|---|---|---|---|
| Closed | Lamar Gregory | $68,800 |
Source: Public Records
Tax History Compared to Growth
Tax History
| Year | Tax Paid | Tax Assessment Tax Assessment Total Assessment is a certain percentage of the fair market value that is determined by local assessors to be the total taxable value of land and additions on the property. | Land | Improvement |
|---|---|---|---|---|
| 2025 | $2,055 | $59,000 | $8,000 | $51,000 |
| 2024 | $2,055 | $62,380 | $8,000 | $54,380 |
| 2023 | $2,072 | $50,936 | $8,000 | $42,936 |
| 2022 | $1,312 | $32,724 | $8,000 | $24,724 |
| 2021 | $1,472 | $35,027 | $8,000 | $27,027 |
| 2020 | $1,452 | $35,027 | $8,000 | $27,027 |
| 2019 | $1,361 | $34,830 | $8,000 | $26,830 |
| 2018 | $1,369 | $34,830 | $8,000 | $26,830 |
| 2017 | $1,314 | $35,453 | $8,000 | $27,453 |
| 2016 | $1,315 | $35,453 | $8,000 | $27,453 |
| 2015 | $1,324 | $35,453 | $8,000 | $27,453 |
| 2014 | $1,325 | $35,453 | $8,000 | $27,453 |
Source: Public Records
Map
Nearby Homes
- 2928 Running Creek Ln
- 3315 Sugar Mill Rd
- 3305 Sugar Mill Rd
- 2307 Creek View Dr
- 2979 Foxhall Cir
- 2944 Foxhall Cir
- 427 Shallowford Cir
- 429 Shallowford Cir
- 3311 Ansley Ct
- 2921 Foxhall Cir
- 33 Londonberry Ln
- 3323 Ravenwood Dr
- 9 Park Place Ct
- 306 Pleasant Home Rd
- 431 Goldfinch Dr
- 203 Buckhead Ct
- 3330 Thread Needle Rd W
- 225 Chatham Rd
- 3324 Westcliffe Ct
- 42 Park Place Cir
- 2914 Running Creek Ln
- 2910 Running Creek Ln
- 2916 Running Creek Ln
- 2908 Running Creek Ln
- 2918 Running Creek Ln
- 2906 Running Creek Ln
- 2920 Running Creek Ln
- 2904 Running Creek Ln
- 2922 Running Creek Ln
- 3319 Sugar Mill Rd
- 2902 Running Creek Ln
- 2324 Creek View Dr
- 3317 Sugar Mill Rd
- 2911 Running Creek Ln
- 2924 Running Creek Ln
- 2913 Running Creek Ln
- 2915 Running Creek Ln
- 2322 Creek View Dr
- 2917 Running Creek Ln
- 2919 Running Creek Ln