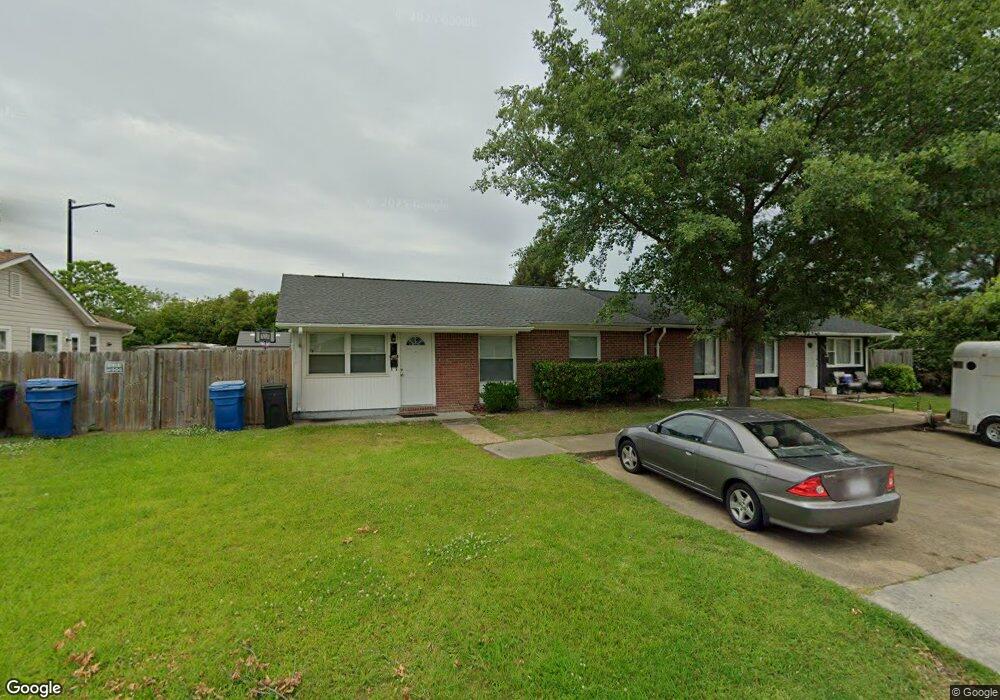
2912 Theodorus Ct Virginia Beach, VA 23453
Lynnhaven NeighborhoodEstimated Value: $244,000 - $279,000
3
Beds
2
Baths
1,150
Sq Ft
$227/Sq Ft
Est. Value
About This Home
This home is located at 2912 Theodorus Ct, Virginia Beach, VA 23453 and is currently estimated at $260,966, approximately $226 per square foot. 2912 Theodorus Ct is a home located in Virginia Beach City with nearby schools including Brookwood Elementary School, Corporate Landing Middle School, and Ocean Lakes High School.
Ownership History
Date
Name
Owned For
Owner Type
Purchase Details
Closed on
Feb 23, 2021
Sold by
Crossbridge Properties Llc
Bought by
Cabrera Jerry Corales
Current Estimated Value
Home Financials for this Owner
Home Financials are based on the most recent Mortgage that was taken out on this home.
Original Mortgage
$181,818
Outstanding Balance
$162,616
Interest Rate
2.7%
Mortgage Type
VA
Estimated Equity
$98,350
Purchase Details
Closed on
Nov 30, 2020
Sold by
Robinson Pierina M and Hicks Pierina M
Bought by
Crpssbridge Properties Llc
Purchase Details
Closed on
Jan 13, 2017
Sold by
Robinson Kirk E and Hicks Pierina M
Bought by
Hicks Pierina M
Purchase Details
Closed on
Aug 27, 2008
Sold by
Talley Eddie L
Bought by
Robinson Kirt E and Hicks,Pierina M
Home Financials for this Owner
Home Financials are based on the most recent Mortgage that was taken out on this home.
Original Mortgage
$163,337
Interest Rate
6.29%
Mortgage Type
VA
Create a Home Valuation Report for This Property
The Home Valuation Report is an in-depth analysis detailing your home's value as well as a comparison with similar homes in the area
Home Values in the Area
Average Home Value in this Area
Purchase History
| Date | Buyer | Sale Price | Title Company |
|---|---|---|---|
| Cabrera Jerry Corales | $175,500 | Accommodation | |
| Crpssbridge Properties Llc | $141,500 | Accommodation | |
| Crossbridge Properties Llc | $141,500 | Fidelity National Title | |
| Hicks Pierina M | -- | None Available | |
| Robinson Kirt E | $159,900 | -- |
Source: Public Records
Mortgage History
| Date | Status | Borrower | Loan Amount |
|---|---|---|---|
| Open | Cabrera Jerry Corales | $181,818 | |
| Previous Owner | Robinson Kirt E | $163,337 |
Source: Public Records
Tax History Compared to Growth
Tax History
| Year | Tax Paid | Tax Assessment Tax Assessment Total Assessment is a certain percentage of the fair market value that is determined by local assessors to be the total taxable value of land and additions on the property. | Land | Improvement |
|---|---|---|---|---|
| 2025 | $2,155 | $228,200 | $95,000 | $133,200 |
| 2024 | $2,155 | $222,200 | $95,000 | $127,200 |
| 2023 | $1,955 | $197,500 | $85,000 | $112,500 |
| 2022 | $1,830 | $184,800 | $75,000 | $109,800 |
| 2021 | $1,656 | $167,300 | $65,000 | $102,300 |
| 2020 | $1,555 | $152,800 | $59,000 | $93,800 |
| 2019 | $1,504 | $150,100 | $54,000 | $96,100 |
| 2018 | $1,505 | $150,100 | $54,000 | $96,100 |
| 2017 | $1,430 | $142,600 | $52,000 | $90,600 |
| 2016 | $1,271 | $128,400 | $45,000 | $83,400 |
| 2015 | $987 | $108,500 | $41,000 | $67,500 |
| 2014 | $1,033 | $101,300 | $50,700 | $50,600 |
Source: Public Records
Map
Nearby Homes
- 2955 Talon Ct
- 3016 Cobblestone Dr
- 3063 Breslaw Ct
- 996 Lynnhaven Pkwy
- 3073 Pewter Rd
- 701 S Lynnhaven Rd
- 725 Burgesses Ln
- 3117 Coach House Ln
- 1010 Scarborough Ct
- 3242 Scarborough Way
- 705 Coach House Ct
- 907 S Club House Rd
- 1199 Old Clubhouse Rd
- 3152 Ashaway Rd
- 733 Lamplight Ln
- 947 Fern Ridge Rd
- 3176 Ashaway Rd
- 3204 Dunnebrook Dr
- 1224 Old Clubhouse Rd
- 3217 Deer Park Dr
- 2908 Theodorus Ct
- 2916 Theodorus Ct
- 2920 Theodorus Ct
- 2904 Theodorus Ct
- 2913 Theodorus Ct
- 2909 Theodorus Ct
- 2917 Theodorus Ct
- 2924 Theodorus Ct
- 2900 Theodorus Ct
- 2921 Theodorus Ct
- 2905 Theodorus Ct
- 2926 Theodorus Ct
- 2925 Theodorus Ct
- 2901 Theodorus Ct
- 2928 Theodorus Ct
- 2912 Peppercorn Ct
- 2916 Peppercorn Ct
- 2927 Theodorus Ct
- 2920 Peppercorn Ct
- 2929 Theodorus Ct