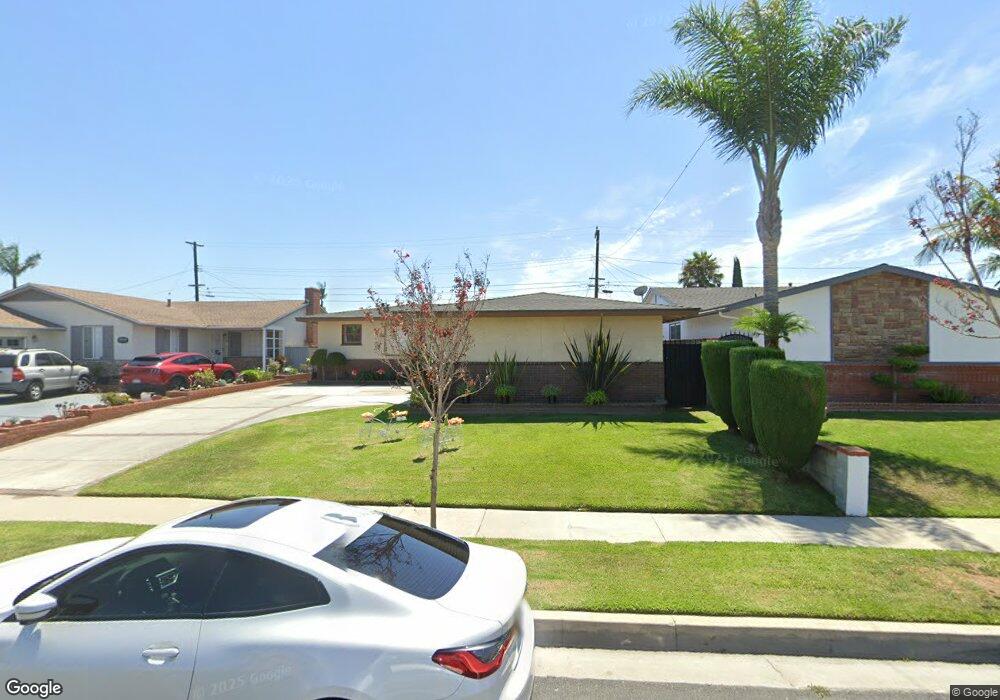
2912 W 136th St Gardena, CA 90249
Estimated Value: $786,000 - $874,000
3
Beds
2
Baths
1,694
Sq Ft
$485/Sq Ft
Est. Value
About This Home
This home is located at 2912 W 136th St, Gardena, CA 90249 and is currently estimated at $821,129, approximately $484 per square foot. 2912 W 136th St is a home located in Los Angeles County with nearby schools including Purche Avenue Elementary School, Robert E. Peary Middle School, and Gardena Senior High School.
Ownership History
Date
Name
Owned For
Owner Type
Purchase Details
Closed on
Oct 29, 2018
Sold by
King Melissa E
Bought by
King Melissa and The King Trust
Current Estimated Value
Purchase Details
Closed on
Dec 13, 2001
Sold by
Jones Don E
Bought by
King Melissa E
Home Financials for this Owner
Home Financials are based on the most recent Mortgage that was taken out on this home.
Original Mortgage
$178,800
Outstanding Balance
$69,555
Interest Rate
6.51%
Estimated Equity
$751,574
Purchase Details
Closed on
Jun 24, 1999
Sold by
Jones Don E
Bought by
Jones Don E and Don Jones Property Trust
Purchase Details
Closed on
Jun 24, 1997
Sold by
Jones Don E
Bought by
Jones Don E
Home Financials for this Owner
Home Financials are based on the most recent Mortgage that was taken out on this home.
Original Mortgage
$100,000
Interest Rate
7.58%
Create a Home Valuation Report for This Property
The Home Valuation Report is an in-depth analysis detailing your home's value as well as a comparison with similar homes in the area
Home Values in the Area
Average Home Value in this Area
Purchase History
| Date | Buyer | Sale Price | Title Company |
|---|---|---|---|
| King Melissa | -- | None Available | |
| King Melissa E | $224,000 | Investors Title Company | |
| Jones Don E | -- | -- | |
| Jones Don E | -- | -- |
Source: Public Records
Mortgage History
| Date | Status | Borrower | Loan Amount |
|---|---|---|---|
| Open | King Melissa E | $178,800 | |
| Previous Owner | Jones Don E | $100,000 |
Source: Public Records
Tax History Compared to Growth
Tax History
| Year | Tax Paid | Tax Assessment Tax Assessment Total Assessment is a certain percentage of the fair market value that is determined by local assessors to be the total taxable value of land and additions on the property. | Land | Improvement |
|---|---|---|---|---|
| 2025 | $4,343 | $330,153 | $248,765 | $81,388 |
| 2024 | $4,343 | $323,681 | $243,888 | $79,793 |
| 2023 | $4,268 | $317,335 | $239,106 | $78,229 |
| 2022 | $4,061 | $311,114 | $234,418 | $76,696 |
| 2021 | $4,014 | $305,015 | $229,822 | $75,193 |
| 2019 | $3,886 | $295,969 | $223,006 | $72,963 |
| 2018 | $3,771 | $290,167 | $218,634 | $71,533 |
| 2016 | $3,592 | $278,902 | $210,146 | $68,756 |
| 2015 | $3,533 | $274,714 | $206,990 | $67,724 |
| 2014 | $3,534 | $269,334 | $202,936 | $66,398 |
Source: Public Records
Map
Nearby Homes
- 13621 Arcturus Ave
- 13228 S Wilkie Ave
- 13717 Chadron Ave
- 13709 Spinning Ave
- 14026 Lemoli Ave Unit C
- 3237 W 132nd St
- 3353 W 135th St
- 13115 Spinning Ave
- 14050 Lemoli Way
- 13945 Lemoli Ave
- 3357 W 134th Place
- 14324 Chadron Ave
- 3512 W 135th St
- 14002 Cerise Ave Unit 11
- 14012 Cerise Ave Unit 3
- 2911 W 129th St
- 3506 W 133rd St
- 2611 W 129th St
- 2817 W 146th St
- 14526 Chadron Ave
- 2908 W 136th St
- 2916 W 136th St
- 2911 W 137th St
- 2904 W 136th St
- 2920 W 136th St
- 2907 W 137th St
- 2915 W 137th St
- 2903 W 137th St
- 2919 W 137th St
- 2911 W 136th St
- 2907 W 136th St
- 2915 W 136th St
- 2924 W 136th St
- 2903 W 136th St
- 2919 W 136th St
- 2923 W 137th St
- 2923 W 136th St
- 13608 Ardath Ave
- 13604 Ardath Ave
- 13612 Ardath Ave