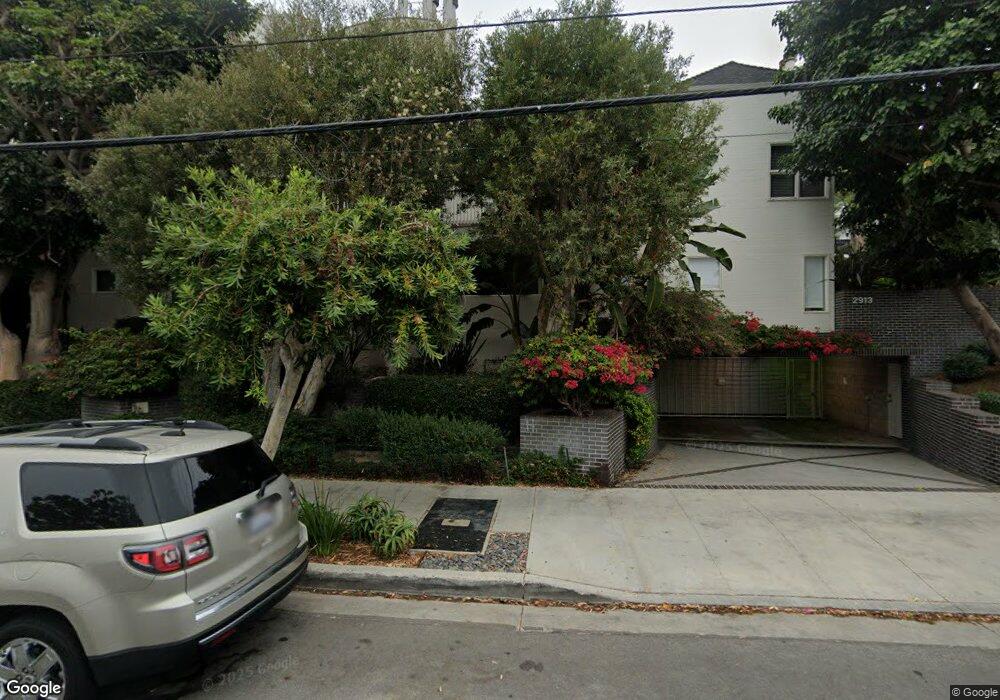
2913 3rd St Unit 206 Santa Monica, CA 90405
Ocean Park NeighborhoodEstimated Value: $1,040,285 - $2,192,000
2
Beds
2
Baths
1,280
Sq Ft
$1,193/Sq Ft
Est. Value
About This Home
This home is located at 2913 3rd St Unit 206, Santa Monica, CA 90405 and is currently estimated at $1,526,821, approximately $1,192 per square foot. 2913 3rd St Unit 206 is a home located in Los Angeles County with nearby schools including John Muir Elementary School, John Adams Middle School, and Santa Monica High School.
Ownership History
Date
Name
Owned For
Owner Type
Purchase Details
Closed on
Aug 2, 2000
Sold by
Trust Bickler Donald And Carolyn Trs Bic and Bickler Steven T
Bought by
Lawrence Lisa M
Current Estimated Value
Home Financials for this Owner
Home Financials are based on the most recent Mortgage that was taken out on this home.
Original Mortgage
$352,000
Outstanding Balance
$128,981
Interest Rate
8.37%
Estimated Equity
$1,397,840
Purchase Details
Closed on
Aug 12, 1997
Sold by
Bickler Donald B and Bickler Carolyn J
Bought by
Bickler Donald B and Bickler Carolyn J
Purchase Details
Closed on
Mar 25, 1994
Sold by
Somerset Terrace Investments
Bought by
Bickler Steven T and Bickler Donald B
Home Financials for this Owner
Home Financials are based on the most recent Mortgage that was taken out on this home.
Original Mortgage
$227,200
Interest Rate
7.15%
Create a Home Valuation Report for This Property
The Home Valuation Report is an in-depth analysis detailing your home's value as well as a comparison with similar homes in the area
Home Values in the Area
Average Home Value in this Area
Purchase History
| Date | Buyer | Sale Price | Title Company |
|---|---|---|---|
| Lawrence Lisa M | $440,000 | Old Republic Title Company | |
| Bickler Donald B | -- | -- | |
| Bickler Steven T | $284,000 | Continental Lawyers Title Co |
Source: Public Records
Mortgage History
| Date | Status | Borrower | Loan Amount |
|---|---|---|---|
| Open | Lawrence Lisa M | $352,000 | |
| Previous Owner | Bickler Steven T | $227,200 |
Source: Public Records
Tax History Compared to Growth
Tax History
| Year | Tax Paid | Tax Assessment Tax Assessment Total Assessment is a certain percentage of the fair market value that is determined by local assessors to be the total taxable value of land and additions on the property. | Land | Improvement |
|---|---|---|---|---|
| 2025 | $8,109 | $662,989 | $412,867 | $250,122 |
| 2024 | $8,109 | $649,990 | $404,772 | $245,218 |
| 2023 | $7,975 | $637,246 | $396,836 | $240,410 |
| 2022 | $7,863 | $624,752 | $389,055 | $235,697 |
| 2021 | $7,649 | $612,503 | $381,427 | $231,076 |
| 2019 | $7,511 | $594,337 | $370,114 | $224,223 |
| 2018 | $7,074 | $582,684 | $362,857 | $219,827 |
| 2016 | $6,804 | $560,060 | $348,768 | $211,292 |
| 2015 | $6,712 | $551,649 | $343,530 | $208,119 |
| 2014 | $6,624 | $540,844 | $336,801 | $204,043 |
Source: Public Records
Map
Nearby Homes
- 3002 3rd St Unit 203
- 2817 3rd St Unit 4
- 3101 5th St Unit 3
- 2940 Neilson Way Unit 103
- 2910 Neilson Way Unit 503
- 2960 Neilson Way Unit 301
- 2960 Neilson Way Unit 105
- 2950 Neilson Way Unit 311
- 2930 Neilson Way Unit 407
- 2644 5th St
- 235 Main St Unit 321
- 3110 Highland Ave
- 245 Main St Unit 114
- 245 Main St Unit 208
- 255 Main St Unit 305
- 252 Hampton Dr
- 114 Pacific Ave
- 2622 2nd St Unit 2
- 2620 2nd St
- 2613 5th St
- 2913 3rd St Unit 104
- 2913 3rd St Unit 102
- 2913 3rd St Unit 101
- 2913 3rd St Unit 406
- 2913 3rd St Unit 405
- 2913 3rd St Unit 310
- 2913 3rd St Unit 309
- 2913 3rd St Unit 308
- 2913 3rd St Unit 307
- 2913 3rd St Unit 306
- 2913 3rd St Unit 305
- 2913 3rd St Unit 304
- 2913 3rd St Unit 302
- 2913 3rd St Unit 205
- 2913 3rd St Unit 204
- 2913 3rd St Unit 203
- 2913 3rd St Unit 202
- 2913 3rd St Unit 201
- 2913 3rd St Unit 407
- 2931 3rd St Unit C