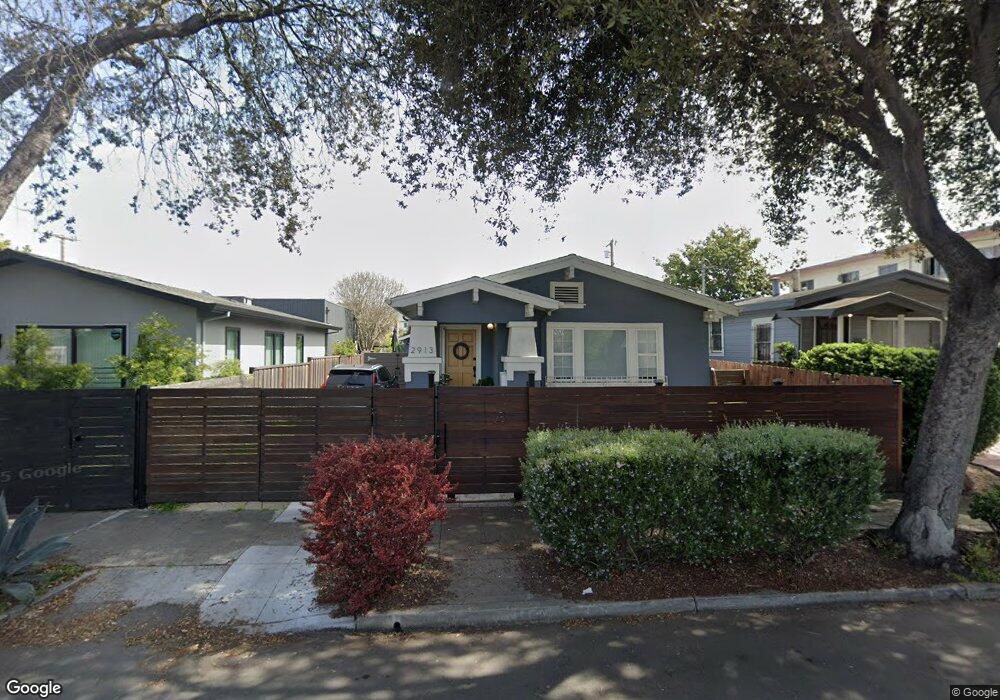
2913 Acton St Berkeley, CA 94702
West Berkeley NeighborhoodEstimated Value: $1,418,000 - $1,527,000
3
Beds
2
Baths
1,706
Sq Ft
$857/Sq Ft
Est. Value
About This Home
This home is located at 2913 Acton St, Berkeley, CA 94702 and is currently estimated at $1,461,994, approximately $856 per square foot. 2913 Acton St is a home located in Alameda County with nearby schools including Malcolm X Elementary School, Washington Elementary School, and Oxford Elementary School.
Ownership History
Date
Name
Owned For
Owner Type
Purchase Details
Closed on
Apr 9, 2019
Sold by
Hentzel Johnson Andrew L and Hentzel Johnson Anna
Bought by
Allen Corinne and Araya Rodrigo
Current Estimated Value
Home Financials for this Owner
Home Financials are based on the most recent Mortgage that was taken out on this home.
Original Mortgage
$920,000
Outstanding Balance
$802,190
Interest Rate
4.3%
Mortgage Type
New Conventional
Estimated Equity
$659,804
Purchase Details
Closed on
Apr 24, 2012
Sold by
Hentzel Johnson Andrew L and Hentzel Johnson Anna
Bought by
Hentzel Johnson Andrew L and Hentzel Johnson Anna
Home Financials for this Owner
Home Financials are based on the most recent Mortgage that was taken out on this home.
Original Mortgage
$300,000
Interest Rate
4.05%
Mortgage Type
New Conventional
Purchase Details
Closed on
Aug 8, 2011
Sold by
Zhang Wen Jia
Bought by
Johnson Andrew L and Hentzel Anna M
Home Financials for this Owner
Home Financials are based on the most recent Mortgage that was taken out on this home.
Original Mortgage
$200,000
Interest Rate
4.53%
Mortgage Type
New Conventional
Purchase Details
Closed on
Apr 6, 2010
Sold by
Spillard Claude and Spillard Crystal Lynn
Bought by
Zhang Wen Jia
Purchase Details
Closed on
Oct 5, 2000
Sold by
Spillard Gwendolyn A and Spillard Claude
Bought by
Spillard Claude and Spillard Crystal Lynn
Home Financials for this Owner
Home Financials are based on the most recent Mortgage that was taken out on this home.
Original Mortgage
$120,000
Interest Rate
7.96%
Purchase Details
Closed on
Aug 30, 2000
Sold by
Leonard A Gross Professional Corp
Bought by
Szaky & Gray Llc
Home Financials for this Owner
Home Financials are based on the most recent Mortgage that was taken out on this home.
Original Mortgage
$120,000
Interest Rate
7.96%
Purchase Details
Closed on
Aug 17, 2000
Sold by
Spillard Gwendolyn A
Bought by
Spillard Gwendolyn A and Spillard Claude
Home Financials for this Owner
Home Financials are based on the most recent Mortgage that was taken out on this home.
Original Mortgage
$120,000
Interest Rate
7.96%
Create a Home Valuation Report for This Property
The Home Valuation Report is an in-depth analysis detailing your home's value as well as a comparison with similar homes in the area
Home Values in the Area
Average Home Value in this Area
Purchase History
| Date | Buyer | Sale Price | Title Company |
|---|---|---|---|
| Allen Corinne | $1,150,000 | Chicago Title Company | |
| Hentzel Johnson Andrew L | -- | Chicago Title Company | |
| Johnson Andrew L | $467,500 | Old Republic Title Company | |
| Zhang Wen Jia | $124,100 | None Available | |
| Spillard Claude | -- | Financial Title Company | |
| Szaky & Gray Llc | $130,000 | First California Title Compa | |
| Spillard Gwendolyn A | -- | -- |
Source: Public Records
Mortgage History
| Date | Status | Borrower | Loan Amount |
|---|---|---|---|
| Open | Allen Corinne | $920,000 | |
| Previous Owner | Hentzel Johnson Andrew L | $300,000 | |
| Previous Owner | Johnson Andrew L | $200,000 | |
| Previous Owner | Spillard Claude | $120,000 |
Source: Public Records
Tax History
| Year | Tax Paid | Tax Assessment Tax Assessment Total Assessment is a certain percentage of the fair market value that is determined by local assessors to be the total taxable value of land and additions on the property. | Land | Improvement |
|---|---|---|---|---|
| 2025 | $17,862 | $1,275,825 | $501,975 | $780,850 |
| 2024 | $17,862 | $1,250,674 | $492,133 | $765,541 |
| 2023 | $17,594 | $1,233,018 | $482,485 | $750,533 |
| 2022 | $17,323 | $1,208,845 | $473,026 | $735,819 |
| 2021 | $17,393 | $1,185,144 | $463,752 | $721,392 |
| 2020 | $16,563 | $1,173,000 | $459,000 | $714,000 |
| 2019 | $8,343 | $526,385 | $157,915 | $368,470 |
| 2018 | $8,192 | $516,068 | $154,820 | $361,248 |
| 2017 | $7,891 | $505,951 | $151,785 | $354,166 |
| 2016 | $7,607 | $496,031 | $148,809 | $347,222 |
| 2015 | $7,501 | $488,583 | $146,575 | $342,008 |
| 2014 | $7,437 | $479,014 | $143,704 | $335,310 |
Source: Public Records
Map
Nearby Homes
- 2922 Stanton St
- 1314 Ashby Ave
- 1535 Julia St
- 2790 Sacramento St
- 2782 Sacramento St
- 2774 Sacramento St
- 1507 Prince St
- 3032 Mabel St
- 1237 Ashby Ave
- 2758 Sacramento St
- 1530 Stuart St
- 1450 Ward St
- 2750 Sacramento St
- 3101 Sacramento St
- 2751 Wallace St
- 3110 California St
- 3114 California St
- 1080 67th St
- 1646 Ashby Ave
- 1515 Derby St
Your Personal Tour Guide
Ask me questions while you tour the home.