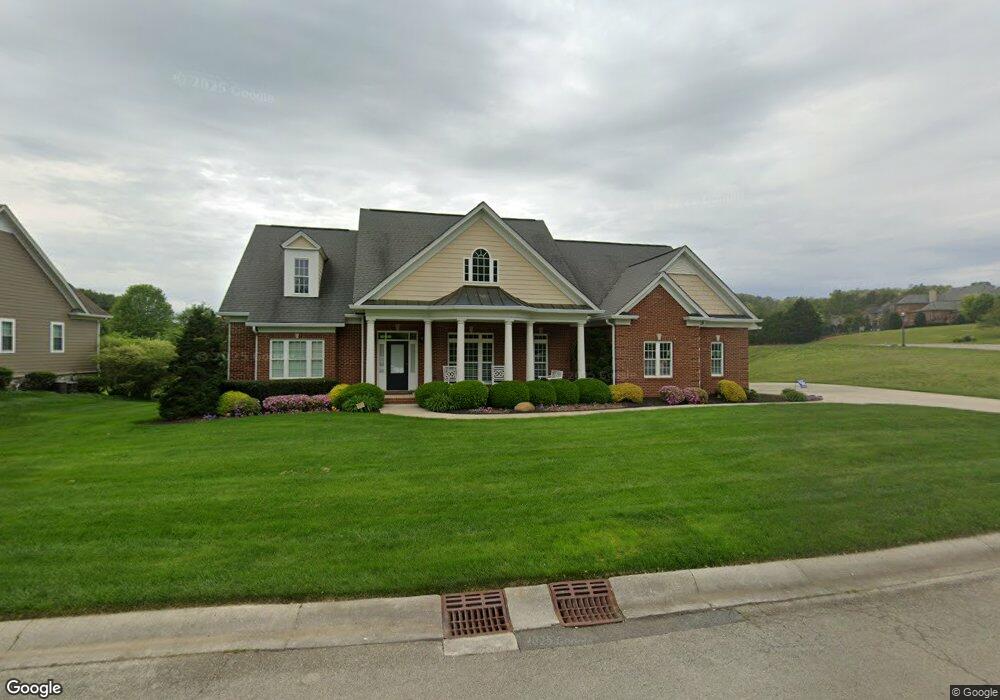
2913 Amesbury Dr Morristown, TN 37814
Estimated Value: $614,961 - $737,000
4
Beds
3
Baths
3,077
Sq Ft
$223/Sq Ft
Est. Value
About This Home
This home is located at 2913 Amesbury Dr, Morristown, TN 37814 and is currently estimated at $685,490, approximately $222 per square foot. 2913 Amesbury Dr is a home located in Hamblen County with nearby schools including Manley Elementary School, West View Middle School, and Morristown West High School.
Ownership History
Date
Name
Owned For
Owner Type
Purchase Details
Closed on
Jun 15, 2018
Sold by
Hill James B and Hill Pam S
Bought by
Rogers Donald C and Rogers Penney P
Current Estimated Value
Purchase Details
Closed on
Feb 28, 2005
Sold by
Place Windsor
Bought by
Hill James B
Purchase Details
Closed on
Jan 24, 1978
Bought by
Catron Samuel N and Catron Anna
Purchase Details
Closed on
May 11, 1974
Create a Home Valuation Report for This Property
The Home Valuation Report is an in-depth analysis detailing your home's value as well as a comparison with similar homes in the area
Home Values in the Area
Average Home Value in this Area
Purchase History
| Date | Buyer | Sale Price | Title Company |
|---|---|---|---|
| Rogers Donald C | $412,500 | Colonial Title Group Inc | |
| Hill James B | $49,500 | -- | |
| Catron Samuel N | -- | -- | |
| -- | -- | -- |
Source: Public Records
Tax History Compared to Growth
Tax History
| Year | Tax Paid | Tax Assessment Tax Assessment Total Assessment is a certain percentage of the fair market value that is determined by local assessors to be the total taxable value of land and additions on the property. | Land | Improvement |
|---|---|---|---|---|
| 2024 | $1,627 | $92,450 | $11,800 | $80,650 |
| 2023 | $1,627 | $92,450 | $0 | $0 |
| 2022 | $2,921 | $92,450 | $11,800 | $80,650 |
| 2021 | $2,921 | $92,450 | $11,800 | $80,650 |
| 2020 | $2,917 | $92,450 | $11,800 | $80,650 |
| 2019 | $2,600 | $76,475 | $8,400 | $68,075 |
| 2018 | $2,409 | $76,475 | $8,400 | $68,075 |
| 2017 | $2,371 | $76,475 | $8,400 | $68,075 |
| 2016 | $2,264 | $76,475 | $8,400 | $68,075 |
| 2015 | $2,106 | $76,475 | $8,400 | $68,075 |
| 2014 | -- | $76,475 | $8,400 | $68,075 |
| 2013 | -- | $95,225 | $0 | $0 |
Source: Public Records
Map
Nearby Homes
- 2978 Wilshire Blvd
- 801 Colonial Dr
- 1054 Colonial Dr
- 700 Drinnon Dr
- 1086 St Ives Ct
- 400 Drinnon Dr
- 2444 Sandstone Dr
- 2454 Sandstone Dr
- 2430 Sandstone Dr
- 2310 Sandstone Dr
- 3471 Walden Dr
- 3475 Walden Dr
- 2045 N Economy Rd Unit A3
- 3542 Wedgewood Dr
- 1033 Walters Dr
- 941 Heykoop Dr
- 725 Barton Dr
- 1736 Jellicorse Rd
- 490 E Sunset Hills
- 3641 Meadowland Dr
- 2913 Amesbury Dr
- 2918 Wilshire Blvd
- 2912 Amesbury Dr
- 2918 Amesbury Dr
- 2933 Amesbury Dr
- 2919 Wilshire Blvd
- 2924 Amesbury Dr
- 2925 Wilshire Blvd
- 2907 Wilshire Blvd
- 734 Berkshire Dr
- 739 Berkshire Dr
- 731 W Economy Rd
- 2938 Wilshire Blvd
- 2933 Wilshire Blvd
- 2939 Amesbury Dr
- 2934 Amesbury Dr
- 761 Berkshire Dr
- 742 Berkshire Dr
- 2939 Wilshire Blvd
- 769 Berkshire Dr