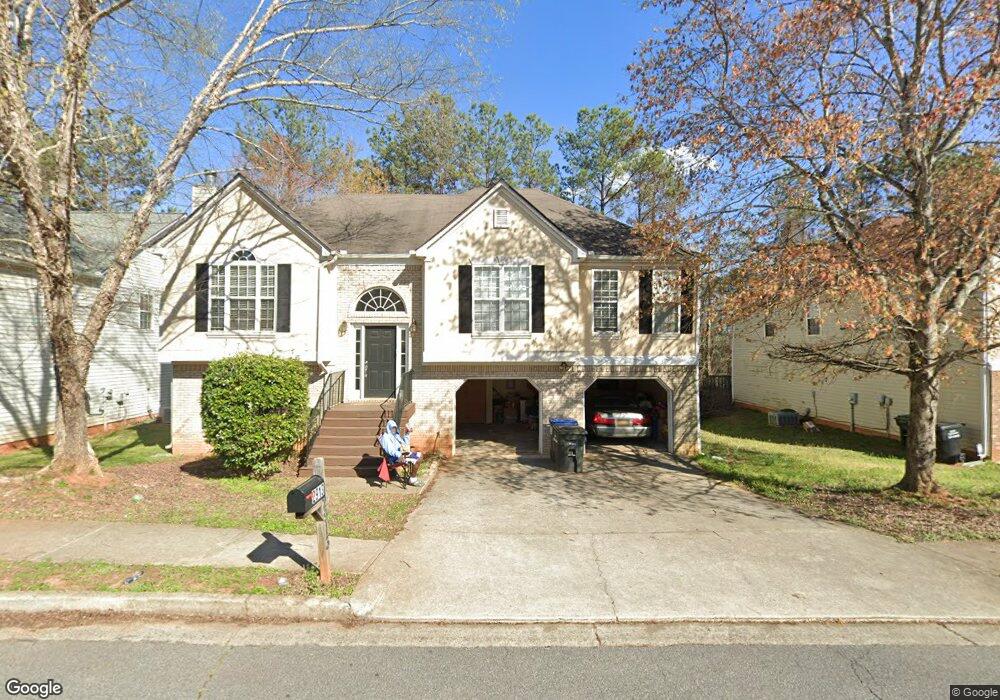
2913 Edgefield Ct SW Unit 6 Marietta, GA 30008
Southwestern Marietta NeighborhoodEstimated Value: $259,000 - $355,000
5
Beds
3
Baths
3,591
Sq Ft
$91/Sq Ft
Est. Value
About This Home
This home is located at 2913 Edgefield Ct SW Unit 6, Marietta, GA 30008 and is currently estimated at $327,712, approximately $91 per square foot. 2913 Edgefield Ct SW Unit 6 is a home located in Cobb County with nearby schools including Birney Elementary School, Smitha Middle School, and Osborne High School.
Ownership History
Date
Name
Owned For
Owner Type
Purchase Details
Closed on
May 15, 2017
Sold by
White Jack Jeremy
Bought by
Tripps Llc
Current Estimated Value
Purchase Details
Closed on
Sep 20, 2013
Sold by
Ngonadi Emeka
Bought by
White Jack Jeremy
Home Financials for this Owner
Home Financials are based on the most recent Mortgage that was taken out on this home.
Original Mortgage
$116,451
Interest Rate
4.57%
Mortgage Type
VA
Purchase Details
Closed on
Aug 9, 2004
Sold by
Ngonadi Emeka
Bought by
Ngonadi Emeka
Purchase Details
Closed on
Sep 13, 2002
Sold by
W & H Properties Llc
Bought by
Ngonadi Emeka
Home Financials for this Owner
Home Financials are based on the most recent Mortgage that was taken out on this home.
Original Mortgage
$157,320
Interest Rate
6.3%
Mortgage Type
New Conventional
Create a Home Valuation Report for This Property
The Home Valuation Report is an in-depth analysis detailing your home's value as well as a comparison with similar homes in the area
Home Values in the Area
Average Home Value in this Area
Purchase History
| Date | Buyer | Sale Price | Title Company |
|---|---|---|---|
| Tripps Llc | $192,000 | -- | |
| White Jack Jeremy | $114,000 | -- | |
| Ngonadi Emeka | -- | -- | |
| Ngonadi Emeka | $174,800 | -- |
Source: Public Records
Mortgage History
| Date | Status | Borrower | Loan Amount |
|---|---|---|---|
| Previous Owner | White Jack Jeremy | $116,451 | |
| Previous Owner | Ngonadi Emeka | $157,320 |
Source: Public Records
Tax History Compared to Growth
Tax History
| Year | Tax Paid | Tax Assessment Tax Assessment Total Assessment is a certain percentage of the fair market value that is determined by local assessors to be the total taxable value of land and additions on the property. | Land | Improvement |
|---|---|---|---|---|
| 2025 | $4,187 | $138,980 | $32,000 | $106,980 |
| 2024 | $3,241 | $107,496 | $12,000 | $95,496 |
| 2023 | $3,241 | $107,496 | $12,000 | $95,496 |
| 2022 | $3,263 | $107,496 | $12,000 | $95,496 |
| 2021 | $2,624 | $86,456 | $12,000 | $74,456 |
| 2020 | $2,624 | $86,456 | $12,000 | $74,456 |
| 2019 | $2,326 | $76,640 | $12,000 | $64,640 |
| 2018 | $2,326 | $76,640 | $12,000 | $64,640 |
| 2017 | $1,936 | $67,336 | $12,000 | $55,336 |
| 2016 | $1,936 | $67,336 | $12,000 | $55,336 |
| 2015 | $1,806 | $61,304 | $10,000 | $51,304 |
| 2014 | $1,354 | $45,568 | $0 | $0 |
Source: Public Records
Map
Nearby Homes
- 3004 Michael Dr SW
- 1108 Byers Dr SW
- 1427 Lost Bridge Rd
- 3141 Holbrook Dr SW
- 2964 Edgemont Ln SW
- 1308 Willamette Way
- 3309 Raes Creek Rd Unit 13
- 1086 Mornington Way
- 3123 Milford Chase SW
- 1020 Hicksmil Dr SW
- 3383 Raes Creek Rd Unit 4
- 3075 Milford Chase SW
- 959 Old Milford Church Rd SW
- 2940 Caller Ct SW
- 2907 Crest Ridge Ct SW
- 3408 Double Eagle Dr Unit 28
- 2913 Edgefield Ct SW
- 2909 Edgefield Ct SW
- 2917 Edgefield Ct SW
- 2921 Edgefield Ct SW
- 2910 Edgefield Ct SW
- 2918 Edgefield Ct SW
- 0 Edgefield Ct SW Unit 7490828
- 0 Edgefield Ct SW Unit 7241536
- 0 Edgefield Ct SW Unit 8159997
- 0 Edgefield Ct SW Unit 8517116
- 0 Edgefield Ct SW Unit 7430518
- 0 Edgefield Ct SW Unit 8213091
- 0 Edgefield Ct SW Unit 7362429
- 0 Edgefield Ct SW Unit 8952607
- 0 Edgefield Ct SW Unit 8833115
- 2920 Edgefield Ct SW
- 2905 Edgefield Ct SW
- 2901 Edgefield Ct SW
- 2922 Edgefield Ct SW
- 2925 Edgefield Ct SW