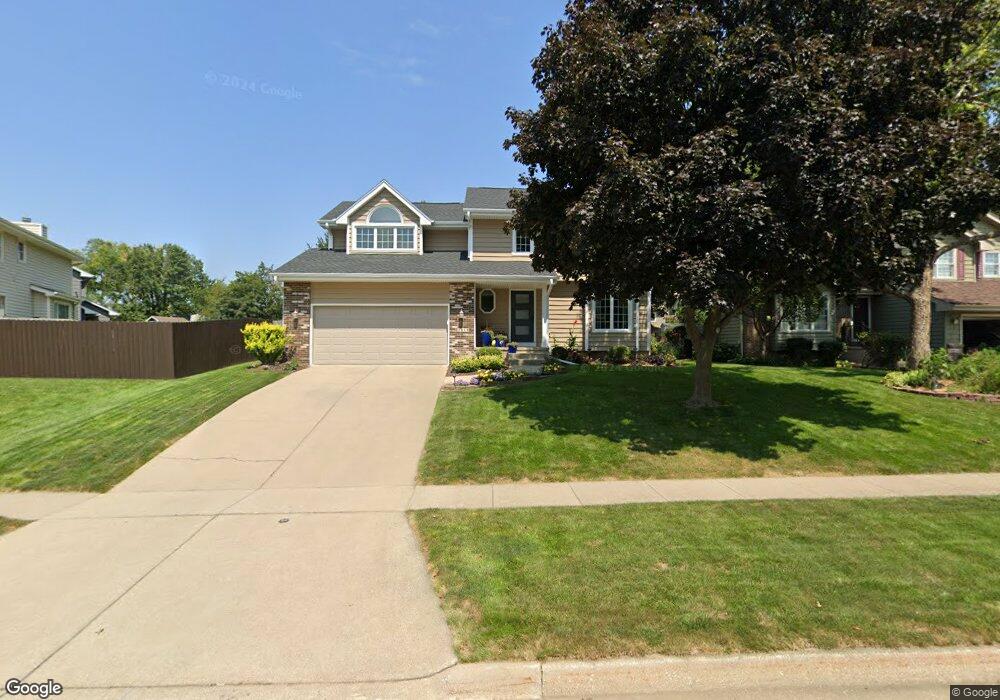
2913 Locust St West Des Moines, IA 50265
Estimated Value: $351,000 - $369,000
3
Beds
3
Baths
1,828
Sq Ft
$196/Sq Ft
Est. Value
About This Home
This home is located at 2913 Locust St, West Des Moines, IA 50265 and is currently estimated at $357,790, approximately $195 per square foot. 2913 Locust St is a home located in Polk County with nearby schools including Fairmeadows Elementary School, Stilwell Junior High School, and Valley Southwoods Freshman High School.
Ownership History
Date
Name
Owned For
Owner Type
Purchase Details
Closed on
Feb 13, 2005
Sold by
Staudt Deborah I
Bought by
Bright Brian S and Bright Christa A
Current Estimated Value
Home Financials for this Owner
Home Financials are based on the most recent Mortgage that was taken out on this home.
Original Mortgage
$120,000
Outstanding Balance
$61,114
Interest Rate
5.78%
Mortgage Type
Fannie Mae Freddie Mac
Estimated Equity
$296,676
Create a Home Valuation Report for This Property
The Home Valuation Report is an in-depth analysis detailing your home's value as well as a comparison with similar homes in the area
Home Values in the Area
Average Home Value in this Area
Purchase History
| Date | Buyer | Sale Price | Title Company |
|---|---|---|---|
| Bright Brian S | $184,500 | -- |
Source: Public Records
Mortgage History
| Date | Status | Borrower | Loan Amount |
|---|---|---|---|
| Open | Bright Brian S | $120,000 |
Source: Public Records
Tax History Compared to Growth
Tax History
| Year | Tax Paid | Tax Assessment Tax Assessment Total Assessment is a certain percentage of the fair market value that is determined by local assessors to be the total taxable value of land and additions on the property. | Land | Improvement |
|---|---|---|---|---|
| 2025 | $5,074 | $366,500 | $66,700 | $299,800 |
| 2024 | $5,074 | $330,600 | $59,300 | $271,300 |
| 2023 | $4,922 | $330,600 | $59,300 | $271,300 |
| 2022 | $4,922 | $263,800 | $48,600 | $215,200 |
| 2021 | $4,862 | $263,800 | $48,600 | $215,200 |
| 2020 | $4,792 | $251,400 | $46,300 | $205,100 |
| 2019 | $4,598 | $251,400 | $46,300 | $205,100 |
| 2018 | $4,606 | $233,000 | $41,700 | $191,300 |
| 2017 | $4,304 | $233,000 | $41,700 | $191,300 |
| 2016 | $4,206 | $212,100 | $37,500 | $174,600 |
| 2015 | $4,206 | $212,100 | $37,500 | $174,600 |
| 2014 | $3,566 | $184,800 | $31,800 | $153,000 |
Source: Public Records
Map
Nearby Homes